
VWAP Strategy Backtest on Bitcoin: Intraday Mean Reversion Results
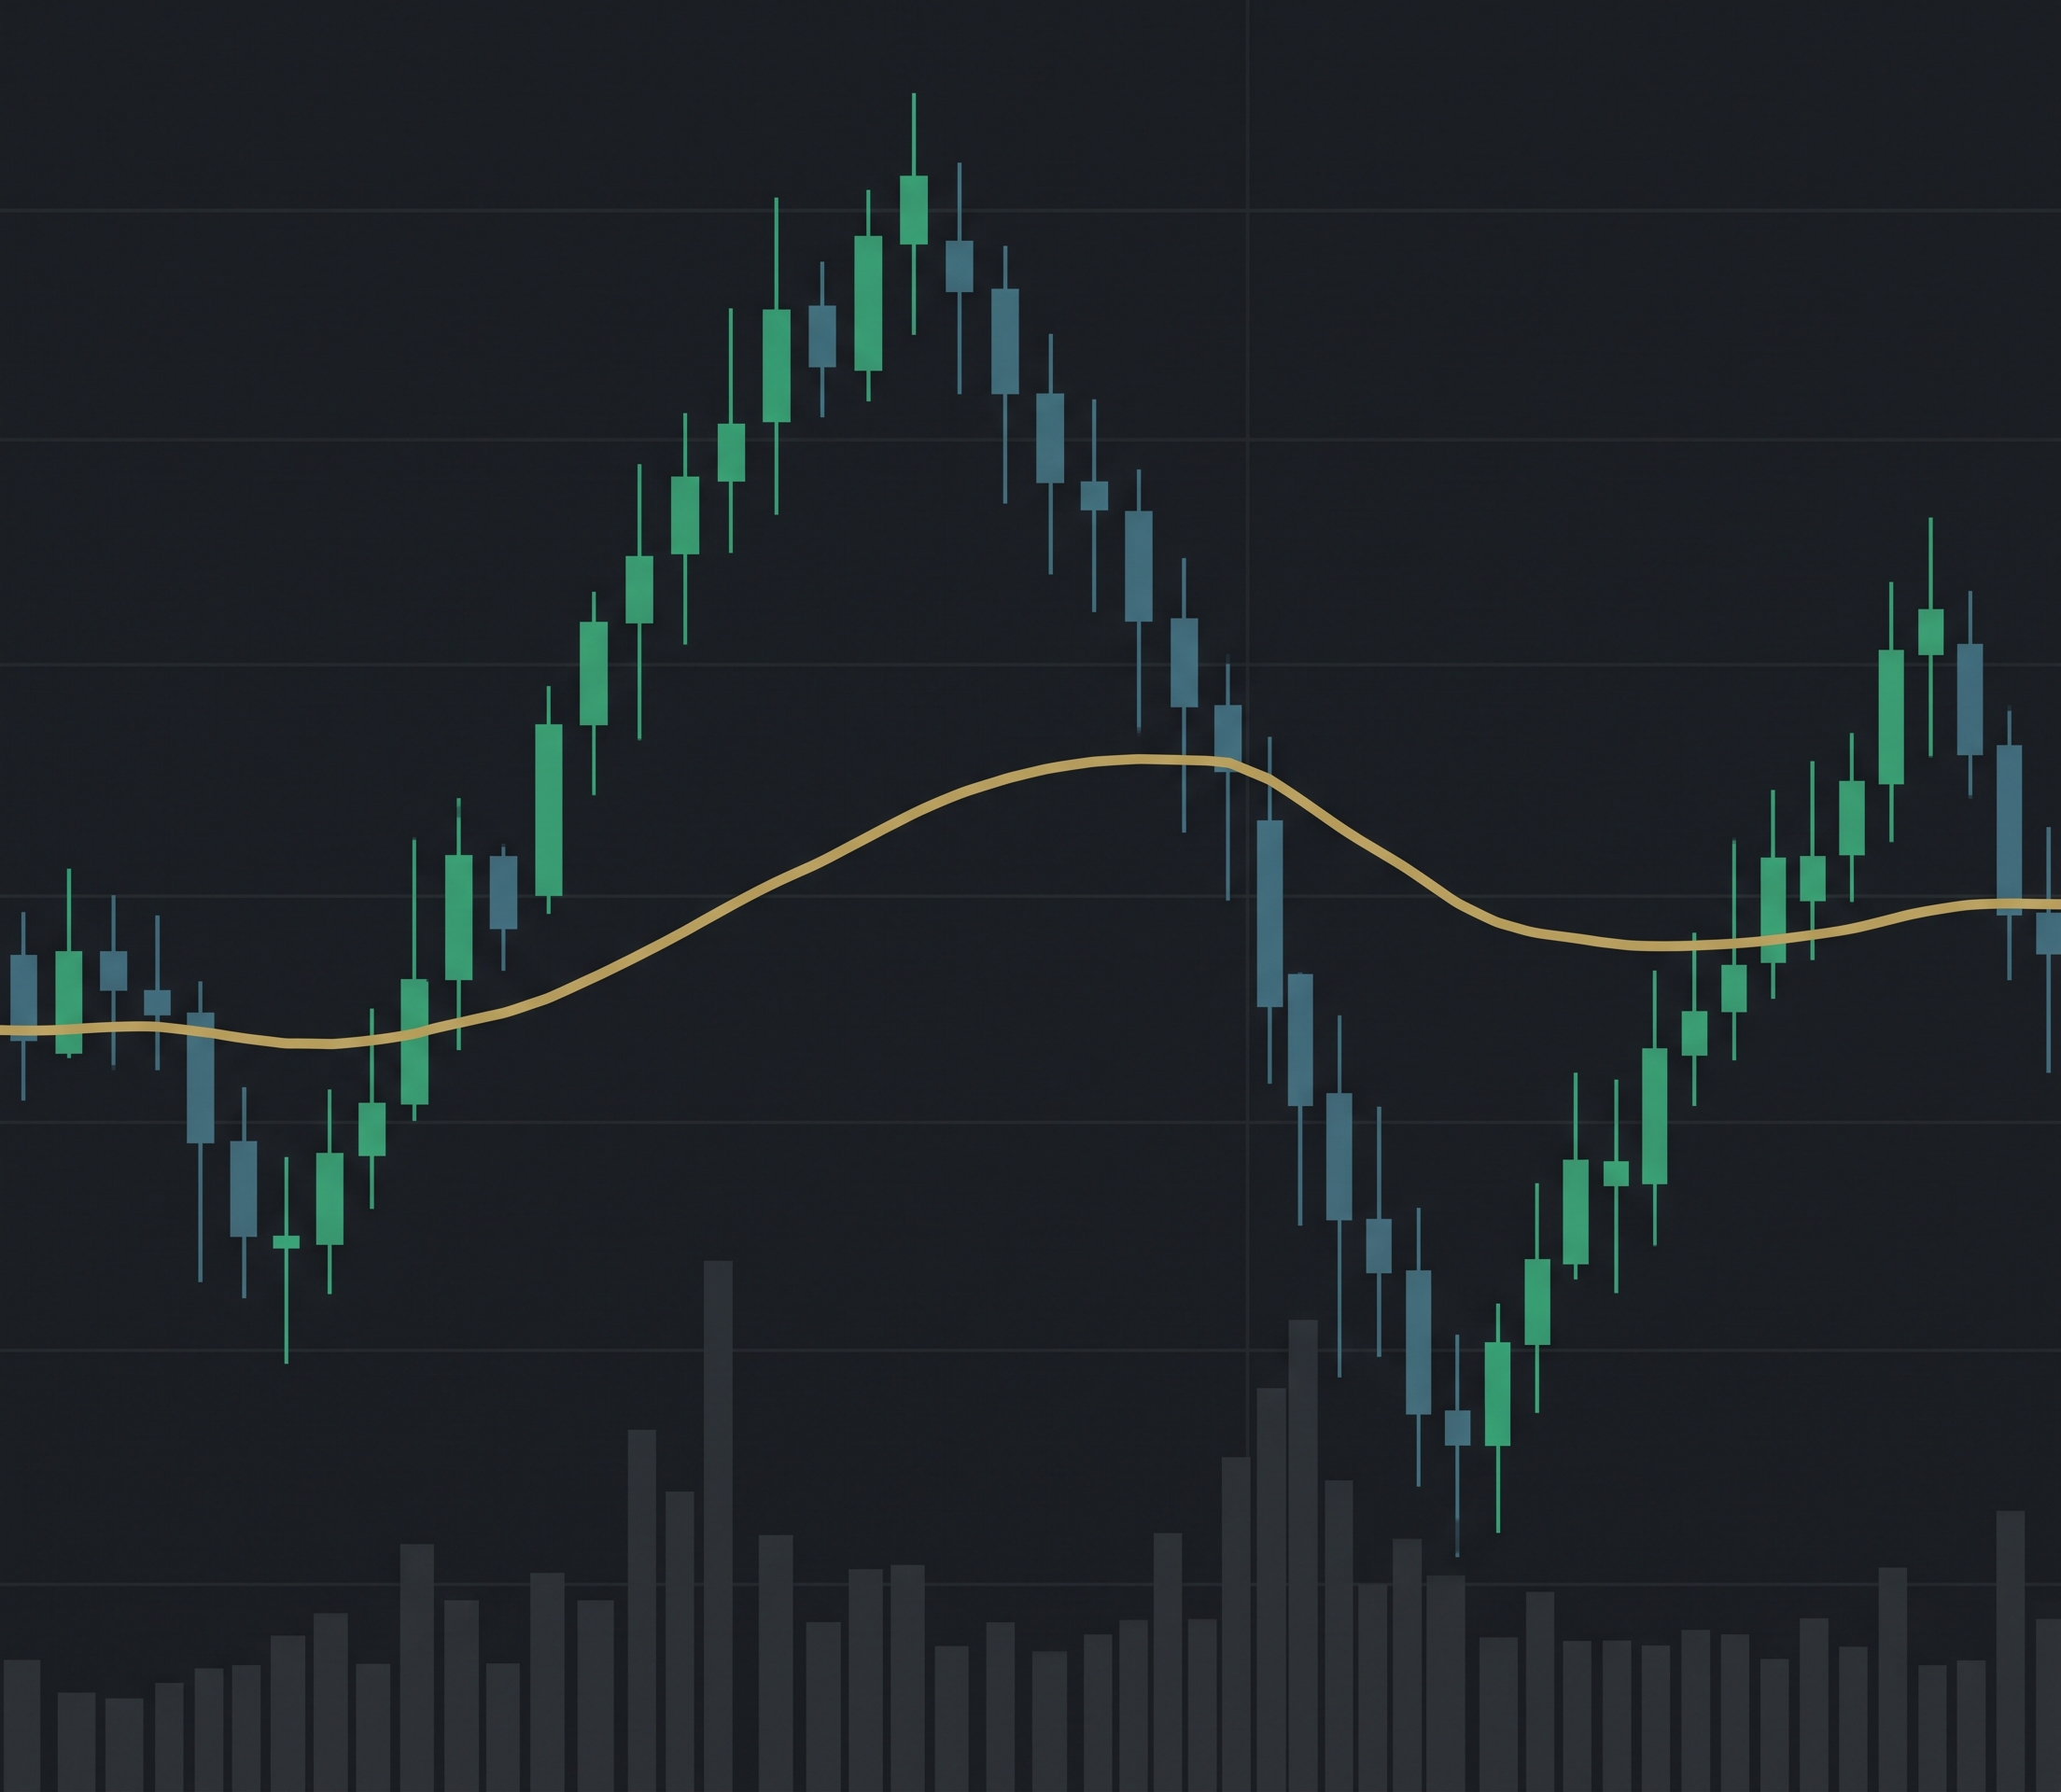
VWAP, the volume-weighted average price, is the reference line institutional desks watch most during an intraday session. Day traders use it to mark fair value: price above VWAP means buyers are in control, price below means sellers. The strategy question is whether a rules-based VWAP mean reversion system can turn that reference line into repeatable profits on Bitcoin.
This article runs the VWAP Intraday Reversion BTC strategy from CoinQuant's strategy library on BTCUSDT hourly data and reports both windows tested: the original three-month window and an extended 15-month version. The results are honest, which means they are not flattering. That is the point.
What the VWAP Strategy Actually Does
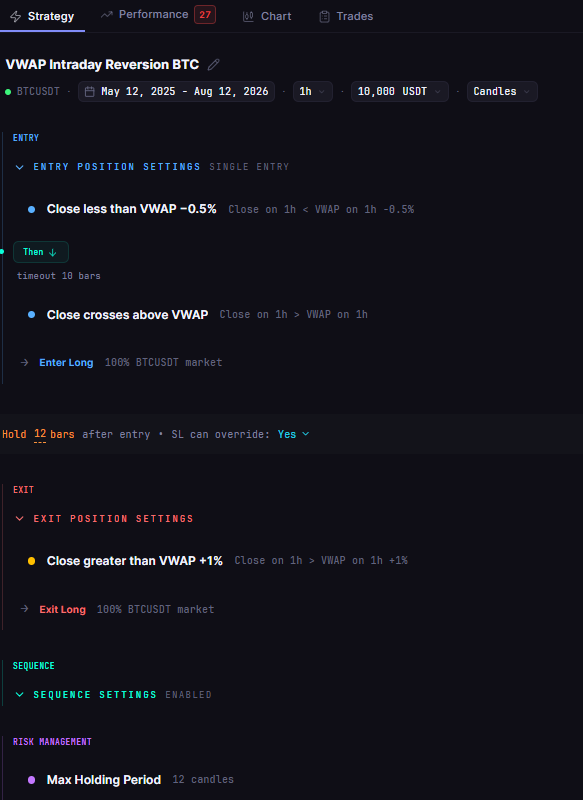
The strategy treats VWAP as a mean reversion anchor on the 1-hour chart. The rules are mechanical:
Entry (sequence): close falls below VWAP by more than 0.5%, then closes back above VWAP, confirming the reversion
Exit: close rises more than 1.0% above VWAP, or the position exits automatically after 12 hours (12 hourly bars), whichever comes first
It is a long-only system with no leverage and a single position at a time. The logic bets that short dips below the session's volume-weighted average price snap back, and it caps both the win and the holding time to keep exposure tight.
Test Setup
Both runs use identical settings apart from the window, so the comparison isolates the effect of test length.
| Parameter | Setting |
|---|---|
| Strategy (library name) | VWAP Intraday Reversion BTC |
| Instrument | BTCUSDT (spot) |
| Timeframe | 1 hour (1h) |
| Tested window | 2026-03-22 to 2026-06-22 (three months) |
| Extended window | 2025-05-12 to 2026-08-12 (15 months) |
| Direction | Long only, no leverage |
| Initial capital | $10,000 |
| Position size | 100% of equity per entry |
| Fees | 0.1% taker, modeled on every trade |
| Data source | Kaiko via CoinQuant |
The Backtest Results: Tested Three-Month Window
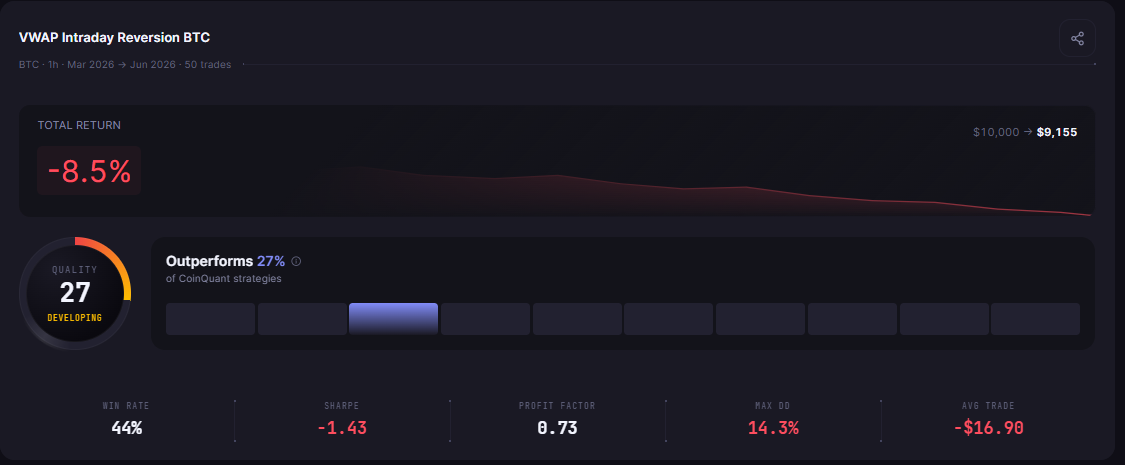
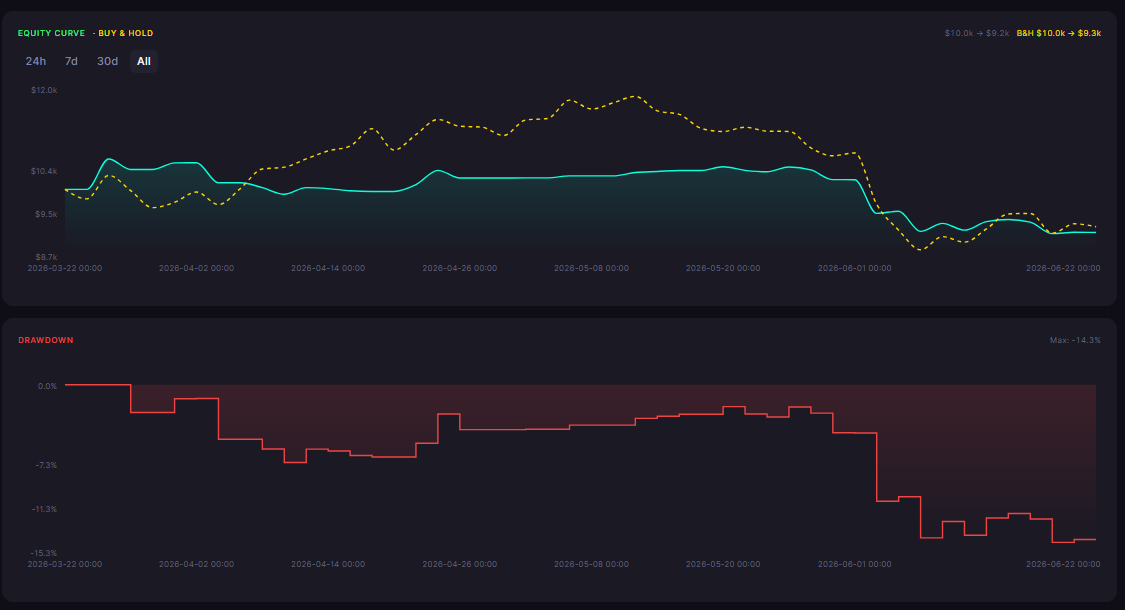
Over the tested three-month window, the strategy turned $10,000 into $9,154.80, a -8.45% total return across 50 trades. Bitcoin itself fell about 7.3% over the same three months, so the strategy underperformed simply holding the asset while trading constantly.
| Metric | Result |
|---|---|
| Total Return | -8.45% ($10,000 → $9,154.80) |
| Total Trades | 50 |
| Win Rate | 44.0% (22W / 28L) |
| Profit Factor | 0.73 |
| Sharpe Ratio | -1.43 |
| Sortino Ratio | -1.87 |
| Max Drawdown | 14.32% |
| Average Win | $102.55 |
| Average Loss | $110.76 |
| Best Trade | +$522.53 |
| Worst Trade | -$520.79 |
| Time in Market | 26.62% |
| Total Fees | $199.22 |
What the Data Shows
The three-month result fails on the metrics that matter. A profit factor of 0.73 means the strategy produced only 73 cents of gross profit for every dollar of gross loss. The payoff ratio of 0.93 confirms the structural problem: average losses ($110.76) slightly exceeded average wins ($102.55).
The win rate of 44% is not the failure point. A mean reversion system can be profitable at 44% if wins are substantially larger than losses. Here they are not, because the 1% above-VWAP exit caps every winner while the 12-hour time exit only bounds the losers. The strategy is designed with a hard ceiling on gains and no equivalent floor on losses, and the numbers show the consequence.
Time in market of 26.62% shows the strategy is selective, holding a position roughly one hour in four. Selectivity without positive expectancy is not a virtue, and in this window it just meant 50 round trips paying fees for a negative edge.
The Extended Window Test
A three-month window on Bitcoin is one market mood. To see whether the failure is a bad quarter or a bad strategy, the same rules were re-run on a patched version of the strategy over 15 months (May 2025 to August 2026), covering a full range cycle: the late-2025 rally, the February 2026 selloff, and the low-volatility range of mid-2026.
The extended window made the verdict worse, not better.
| Metric | Three months | 15 months |
|---|---|---|
| Total Return | -8.45% | -32.90% |
| Total Trades | 50 | 232 |
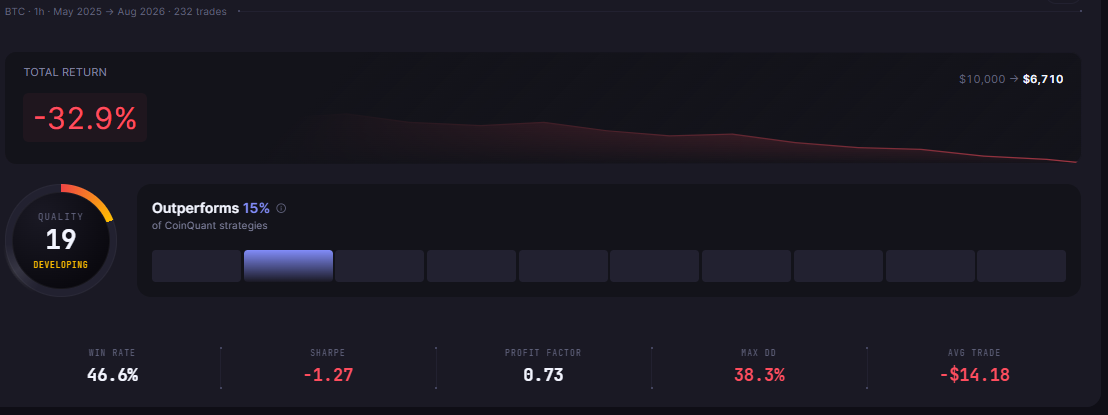
| Win Rate | 44.0% | 46.6% |
| Profit Factor | 0.73 | 0.73 |
| Sharpe Ratio | -1.43 | -1.27 |
| Max Drawdown | 14.32% | 38.27% |
| Total Fees | $199.22 | $793.55 |
| Final Balance | $9,154.80 | $6,710.17 |
Over 15 months the strategy lost 32.90% while buy-and-hold Bitcoin lost about 39% in the same period. The strategy did not quite match the market's loss, but it absorbed a 38.27% max drawdown to do it, meaning at the worst point nearly four in ten dollars of the account were underwater. The profit factor held steady at 0.73 across both windows, which is the most important finding: the edge is consistently negative, not unlucky.
VWAP vs Simply Holding Bitcoin
The honest benchmark for any strategy is the alternative: doing nothing, or holding the asset.
| Approach | Three months | 15 months |
|---|---|---|
| VWAP Intraday Reversion BTC | -8.45% | -32.90% |
| Buy and hold Bitcoin | -7.3% (approx.) | -39% (approx.) |
The strategy beat buy and hold in the extended window by a narrow margin while trading 232 times, and it lost to buy and hold in the tested window. Neither outcome justifies the complexity. A strategy that cannot clearly beat the passive benchmark after hundreds of trades and hundreds of dollars in fees has not earned its place in a live account.
Why the Window Test Matters
Running the same strategy on two very different windows is not optional diligence, it is the fastest way to separate a bad parameterization from a bad period. A single favorable window can make almost any rule look plausible, which is why the calendar for this backtest explicitly required a patched extended-window version in addition to the tested window.
The extended run answered the question the three-month run could not: is the edge negative because of the quarter, or because of the rules? The profit factor held at 0.73 in both windows, the win rate stayed in the mid-40s, and the drawdown scaled with the longer data. When a metric set is that stable across regimes, the verdict is about the strategy, not the sample.
That stability is also the honest version of this test. A VWAP article that reported only a flattering window would be doing the opposite of what backtesting is for. Reporting the negative result is the point.
The Practical Lesson
The VWAP intraday mean reversion test on Bitcoin is a controlled experiment in what a bad parameterization looks like:
The exit design caps the edge. A 1% profit target with a 12-hour time exit produces wins and losses of nearly equal size, and the payoff ratio of 0.93 confirms it
The edge is consistently negative. Profit factor 0.73 held across two very different windows, which rules out bad luck
The drawdown is the real cost. 38.27% max drawdown in the extended run is a brutal experience for a strategy that lost money
Fees compound the problem. 232 trades generated $793.55 in fees on a losing account
The lesson is not that VWAP is useless. VWAP remains a legitimate institutional reference level, and the VWAP indicator explainer covers how traders use it. The lesson is that this specific rule set, a 0.5% reversion entry with a 1% capped exit, does not work on hourly Bitcoin, and no amount of window-selection would have made it work.
The next step for a trader who wants to pursue the idea is systematic: widen the exit target, add a stop loss, or filter by higher-timeframe trend, and test each change as its own backtest before risking capital. That is exactly what backtesting is for, seeing the drawdown on a spreadsheet instead of in the account.
Disclaimer:
Key Takeaway
