
Volume Surge on Ethereum: 1D vs 4H Backtest, Does Timeframe Change the Signal?

Volume is the same data on every timeframe, but the signal it produces is not. A volume surge on the daily chart means something different from a volume surge on the 4-hour chart, because each timeframe defines "surge" against a different baseline of normal activity. The question is which one makes a better trading signal for Ethereum.
This article runs the exact same volume surge breakout strategy on two timeframes, daily and 4-hour, over the same window from August 2025 to August 2026. Same rules, same asset, same fees. The timeframe alone changed the outcome from a loss to a much deeper loss, and the difference is explainable.
The Strategy and the Two Timeframes
The strategy is a simple volume-confirmed breakout:
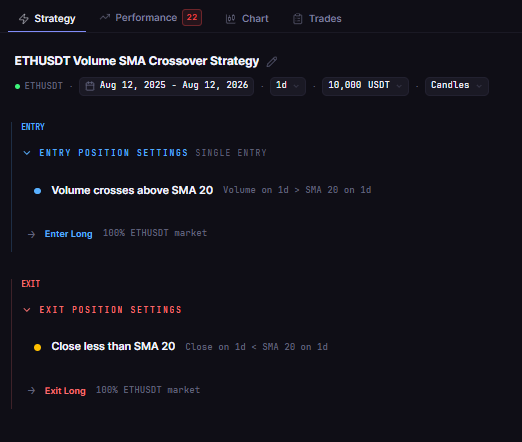
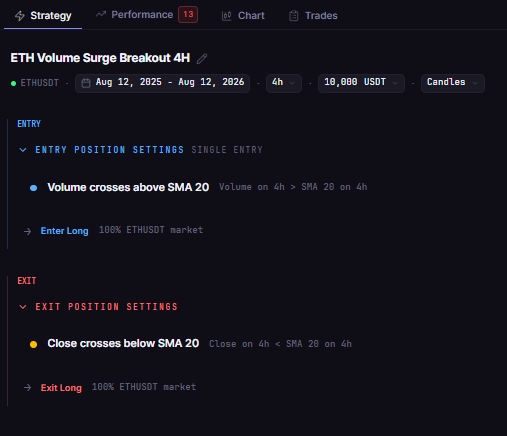
Entry: volume crosses above its 20-period simple moving average
Exit: close falls below (1D) or crosses below (4H) the 20-period SMA of close
The logic is that a surge in volume marks genuine participation, and the strategy buys the move when participation expands. It is long only, one position at a time, 100% of equity per entry, 0.1% taker fee modeled.
The only difference between the two tests is the timeframe the 20-period window is measured on. On the daily chart, a 20-period baseline is 20 days. On the 4-hour chart, it is roughly 80 hours, and there are six times more bars in the same window.
Test Setup
| Parameter | ETH Volume Surge Breakout 1D | ETH Volume Surge Breakout 4H |
|---|---|---|
| Strategy (library names) | ETH Volume Surge Breakout 1D | ETH Volume Surge Breakout 4H |
| Instrument | ETHUSDT (spot, Binance) | ETHUSDT (spot, Binance) |
| Timeframe | Daily (1D) | 4H |
| Tested window | 2025-08-12 to 2026-08-12 | 2025-08-12 to 2026-08-12 |
| Entry | Volume crosses above SMA(20) of volume | Volume crosses above SMA(20) of volume |
| Exit | Close below SMA(20) of close | Close crosses below SMA(20) of close |
| Direction | Long only, no leverage | Long only, no leverage |
| Initial capital | $10,000 | $10,000 |
| Position size | 100% of equity per entry | 100% of equity per entry |
| Fees | 0.1% taker, modeled | 0.1% taker, modeled |
| Data source | Kaiko via CoinQuant | Kaiko via CoinQuant |
The Backtest Results
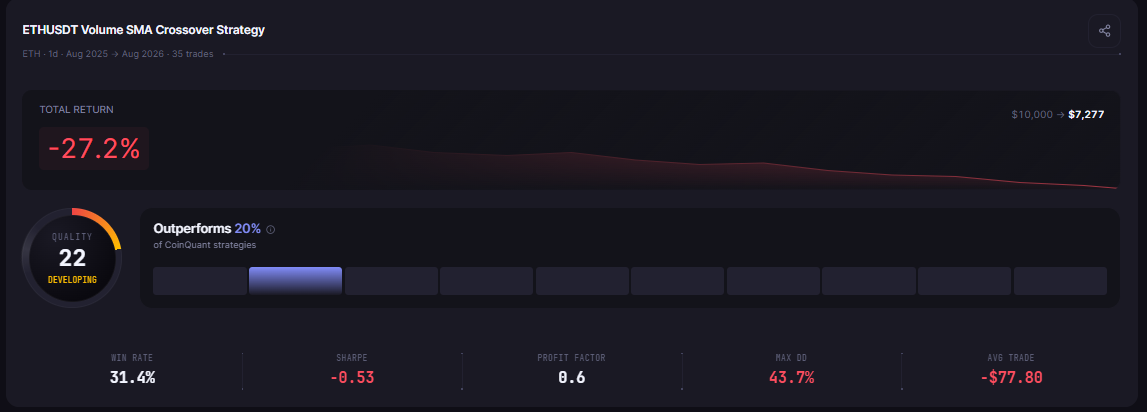
Both timeframes lost money. The daily version lost 27.23% of the account, and the 4-hour version lost 54.18%. The same signal, on a faster timeframe, lost twice as much.
| Metric | 1D (daily) | 4H |
|---|---|---|
| Total Return | -27.22% | -54.17% |
| Final Balance | $7,277.66 | $4,582.85 |
| Total Trades | 35 | 97 |
| Win Rate | 31.4% (11W / 24L) | 41.2% (40W / 57L) |
| Profit Factor | 0.60 | 0.54 |
| Sharpe Ratio | -0.53 | -1.24 |
| Max Drawdown | 43.72% | 65.69% |
| Average Win | $373.76 | $162.15 |
| Average Loss | $284.74 | $208.83 |
| Best Trade | +$1,005.32 | +$627.45 |
| Worst Trade | -$822.28 | -$2,210.51 |
| Time in Market | 43.17% | 78.82% |
| Total Fees | $117.37 | $265.27 |

The Fee Multiplier
Fees are the quiet amplifier of the timeframe problem. The 4H version took 97 round trips and paid $265.27 in fees. The 1D version took 35 round trips and paid $117.37. On a strategy that already lost money, the faster timeframe did not just trade more, it paid more to lose more.
This is the fee lesson in its purest form: trade count is a cost driver, and timeframe determines trade count. A signal that fires six times more often on 4H than on 1D multiplies every per-trade cost, including the costs that are invisible on a chart.
What the Data Shows
The 4-hour version traded nearly three times as often, 97 trades versus 35, and spent 78.82% of the time in the market versus 43.17% on the daily chart. Volume surges are far more common on 4-hour bars, so the strategy was in and out of Ethereum constantly, paying fees on every round trip and catching far more false moves.
The win rate actually improved on 4H, 41.2% versus 31.4%, but the wins got smaller. The 4H average win of $162.15 was less than half the daily average win of $373.76, while the worst trade deepened from -$822.28 to -$2,210.51. More trades, smaller wins, bigger disasters, and double the fees: the faster timeframe amplified everything the strategy did wrong.
Why the Daily Signal Was the Better One
The daily volume surge is a genuine participation event. When daily volume crosses above its 20-day average, it means a full day traded well above normal activity, which is a real shift in market attention. The 4-hour surge is a much weaker signal, because intraday volume naturally pulses with the trading day, and a single busy 4-hour window is often just normal rhythm, not a breakout.
The time in market gap tells the same story. On the daily chart the strategy was selective, in the market less than half the time. On 4H it was almost always in a position, chasing surge after surge through chop. A strategy that is always in the market has no filter left, and this one had no edge to make up for it.
The Practical Lesson
Timeframe changed the signal, not just the frequency: the same rules lost 27.23% on 1D and 54.18% on 4H
The 4H version traded 97 times, spent 78.82% of the window in the market, and paid $265.27 in fees, and every one of those numbers made it worse
A daily volume surge is a participation event; a 4-hour surge is often normal intraday rhythm
Slower timeframes built-in selectivity: 43.17% time in market on 1D versus 78.82% on 4H
The timeframe question has a data-backed answer for this strategy on Ethereum: the daily signal was the better signal, and even it lost money. Neither version is tradeable as tested, which is exactly the kind of result worth knowing before risking capital. The next step is to test variations: a volume surge threshold above 1.5x the average, a trend filter on the higher timeframe, or a breakout confirmation on price. Each variation needs its own backtest.
Run these two timeframe variants yourself and test your own volume settings on CoinQuant. Run this volume surge backtest free on CoinQuant
Disclaimer:
Key Takeaway