Swing Trading Bitcoin in a Bear Market: 6 Months of Backtest Data
.png)
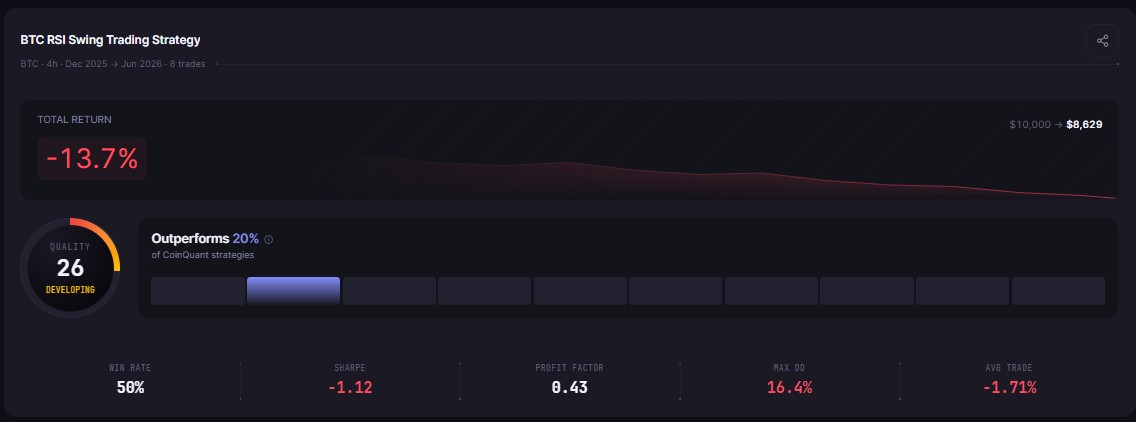
Not every swing trading bitcoin strategy backtest looks good. This one does not. Over six months from December 2025 to June 2026, a long-only BTC swing strategy on the four-hour chart returned negative 13.71%, turning a $10,000 starting balance into $8,628.64. Bitcoin fell roughly 55% from its cycle high during this period, and the strategy kept buying into a sustained downtrend. That is exactly the kind of result worth publishing. Reading a losing backtest honestly is one of the most important skills a systematic trader can build, and the metrics here point directly at what went wrong and how to fix it.
The Strategy and Test Setup
The strategy tested here is a long-only BTC swing approach on the four-hour timeframe. It runs on BTCUSDT from December 18, 2025 to June 18, 2026, a six-month window that sits inside one of the sharper bear phases of the current cycle.
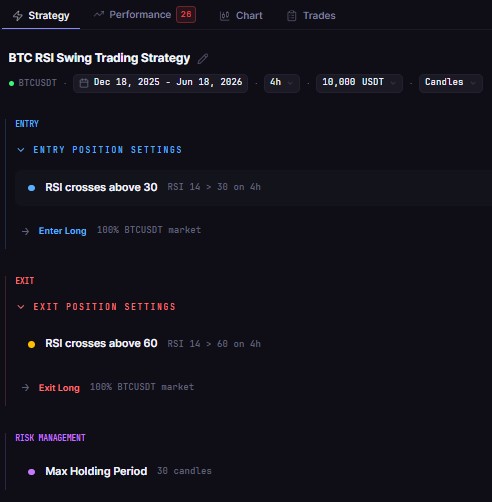
The logic is mean-reversion swing: enter when price signals a short-term oversold condition and a potential bounce, exit when a recovery target is reached or momentum exhausts. No short positions. No trend filter applied to the higher timeframe. That omission is where the strategy breaks, and the numbers show exactly why.
Fees are modelled at the default 0.1% taker rate in CoinQuant's backtesting engine, producing a total fee load of $29.04 across eight trades. Data is sourced from Kaiko's institutional feed, the same source used across all CoinQuant backtests. No results were adjusted after reviewing the output. The metrics below are reproduced exactly as the platform returned them.
For background on structuring a swing strategy and what to type into the AI builder, see What Is Crypto Swing Trading and How Do You Backtest It?.
The Full Backtest Results
Here are the complete results from the six-month bear market run:
What the Core Metrics Tell You
The first metric to read on any backtest is the Sharpe Ratio. A Sharpe of negative 1.12 means the strategy produced negative returns relative to the volatility it took on. This is an immediate disqualifier for live deployment. A viable swing strategy needs a Sharpe above 1.0 to justify the holding risk and the drawdown exposure.
The Profit Factor of 0.43 confirms the same verdict from a different angle. A Profit Factor below 1.0 means total losses exceeded total gains over the test period. At 0.43, the strategy lost more than twice what it made. There was no profitable edge in this window.
The Sortino Ratio of negative 0.54 isolates downside volatility specifically. Unlike the Sharpe, the Sortino only penalises losses rather than all volatility. A negative Sortino on top of a negative Sharpe means the losses were not random variance: the strategy was directionally wrong, not just noisy.
The Calmar Ratio of negative 1.56 connects annualized return to max drawdown. With a CAGR of negative 25.6% and a Max Drawdown of 16.38%, the strategy produced more than one dollar of annualized loss for every dollar of peak-to-trough decline. There was no recovery to offset the drawdown.
The SQS of 26 out of 100 reflects the composite picture. CoinQuant's strategy quality score weights risk-adjusted return, consistency, and drawdown control together. A score below 40 signals a strategy that needs significant rework before it is worth refining further.
Why Win Rate Does Not Save This Strategy
The 50% win rate looks tolerable on its own. Half the trades were winners. But win rate without the payoff ratio is incomplete information, and that gap is where most traders misread a result like this.
The average win was $260.07. The average loss was $602.91. That is a payoff ratio of 0.43, matching the Profit Factor almost exactly. Each losing trade cost more than twice what each winning trade returned. Across eight trades, the math runs in one direction only.
This is the most common trap in mean-reversion swing results. A strategy can show a 60% or even 70% win rate and still be unprofitable if losses are large enough relative to wins. The worst trade here was negative $1,021.53 against a best trade of positive $403.23. A single bad entry wiped out two and a half average wins. The ratio between average win and average loss is the number that matters, and 0.43 is well below the 1.5 minimum that makes a swing strategy viable.
[Screenshot: CoinQuant AI strategy builder showing the swing strategy conditions entered in the natural language text field, with the AI interpreting the entry and exit logic before running the backtest]
The Missing Trend Filter
This strategy placed eight long entries during a period when Bitcoin fell roughly 55% from its cycle high. Every entry was in the direction opposite to the dominant trend. Mean-reversion entries work when prices oscillate around a stable mean. They break in sustained directional moves, which is exactly what a bear market is.
The fix is straightforward to test: add a higher-timeframe trend filter. A condition such as "only enter long if BTC is trading above its 200-day moving average" or "only enter if the daily trend is upward" prevents the strategy from buying into an ongoing downtrend. The expected outcome is fewer total entries, but a much higher win rate on the trades that do trigger, because each entry aligns with the broader market direction rather than fighting it.
The time in market figure of 26.27% offers a clue about the mechanics here. The strategy spent less than 30% of the six-month window in a position. The losses were concentrated in fewer than a third of the candles, which means the problem is not general exposure: it is selective bad timing at entry. A trend filter addresses that precisely.
Testing the modified version on the same six-month window in CoinQuant takes seconds. Adjust the entry condition to require a trend alignment filter, re-run, and compare the new Sharpe and Profit Factor against these baseline numbers. That iteration process is what backtesting is built for.
What a Losing Backtest Is Actually For
Publishing a negative result is a deliberate choice. The trading content landscape is full of strategies tested on carefully selected bull-market windows where almost any long strategy looks good. That is survivorship bias at the content level.
This test ran from December 18, 2025 to June 18, 2026 because that was the most recent six-month bear market window in CoinQuant's Kaiko data at the time of testing. The strategy was not adjusted after seeing the results.
Three things make this result informative rather than just negative. First, the Sharpe of negative 1.12 and Profit Factor of 0.43 give precise numerical targets for what improvement looks like. A revised strategy needs both of those above 1.0 before it merits further attention. Second, the gap between average loss and average win identifies the structural problem exactly: the exit logic is not cutting losses early enough. Third, the 26.27% time in market shows that the underperformance happened in a small fraction of the test window, meaning the problem is entry selection, not the overall approach.
A trader who reads these metrics correctly will know exactly what to change. That is the point of testing on paper before committing capital. Fail systematically, diagnose accurately, and refine before risking real money.
Backtest your swing strategy on CoinQuant
Disclaimer:
This content is for educational and informational purposes only and does not constitute financial, investment, or trading advice. All strategies and examples are for illustrative purposes and do not guarantee results. Always conduct your own research before making financial decisions.
Key Takeaway