Stochastic Oscillator on Ethereum: Does This Momentum Indicator Hold Up in a Downtrend?
.png)
The stochastic oscillator strategy backtest crypto traders run most often targets oversold conditions: wait for the %K line to dip below 20, then buy the bounce back above that level. The theory is sound in a ranging or recovering market. The problem is what happens when Ethereum spends six months in a sustained downtrend. We ran this exact strategy on ETHUSDT across December 22, 2025 to June 22, 2026 on CoinQuant's AI trading platform. The result was negative 33.37%, and the breakdown of that number is more instructive than the headline alone.
The Strategy and Test Setup
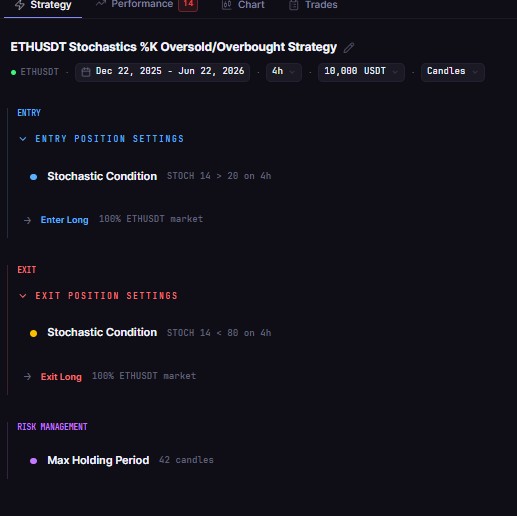
The strategy uses a single rule: buy ETHUSDT on the four-hour chart when Stochastic %K(14) crosses above 20 from an oversold reading. The exit fires when %K crosses back below 80 (signalling overbought) or after seven days, whichever comes first. No trend filter. No stop loss added at the strategy level. Long positions only.
Test parameters:
Asset: ETHUSDT
Timeframe: 4-hour candles
Period: December 22, 2025 to June 22, 2026 (six months)
Starting capital: $10,000
Fees: 0.1% taker, modelled on every trade
Direction: Long only
Data is sourced from Kaiko's institutional feed, the same source used across all CoinQuant backtests. No conditions were adjusted after reviewing the output. All metrics below are reproduced exactly as the platform returned them.
The Full Backtest Results
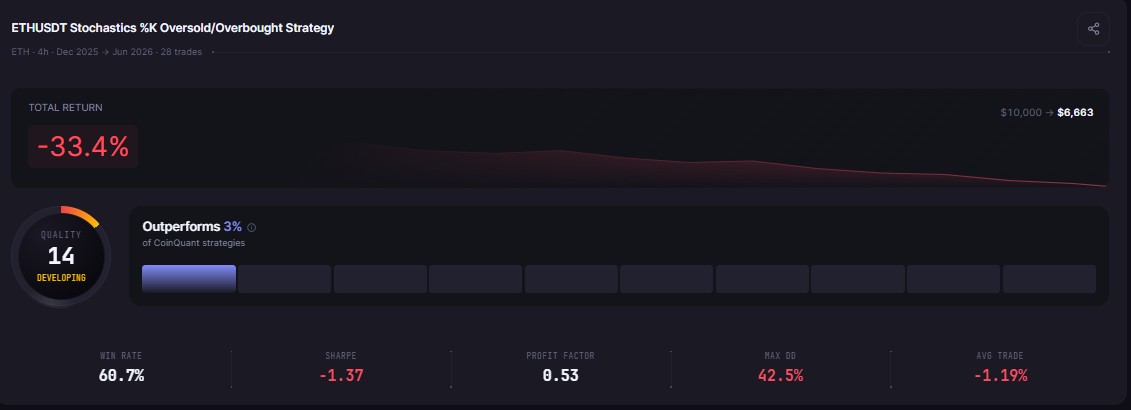
What a 60.7% Win Rate Is Actually Hiding
Most traders see a 60.7% win rate and read it as a working system. More than three in five trades closed profitably. That looks like an edge. The problem is that win rate is only half the information. The payoff ratio tells the other half.
The average winning trade returned $222.87. The average losing trade cost $647.83. The ratio of those two numbers is 0.34, meaning every dollar won cost roughly three dollars of exposure on the losing side. Across 28 trades, this asymmetry compounds in one direction only.
The Profit Factor of 0.53 confirms the verdict. A Profit Factor below 1.0 means total losses exceeded total gains over the full test window. At 0.53, the strategy earned 53 cents in gross profit for every dollar of gross loss. Before even accounting for fees, the system had no profitable edge in this market environment.
The worst single trade lost $3,258.65. In dollar terms, that one position wiped out more than 14 average winning trades. A strategy can run 14 wins in a row and still fall further behind if one runaway loss is permitted to develop without a stop.
The Downtrend Problem
Ethereum fell sharply during the test window. The strategy entered long positions 28 times across that six-month period because the Stochastic kept crossing above 20. Each of those signals was technically valid according to the indicator's logic. But the indicator cannot distinguish between a temporary dip in a recovery and a continued slide in a downtrend. Both produce the same %K reading.
The Max Drawdown of 42.55% reflects what happens when a long-only mean-reversion system keeps entering into falling conditions. The account dropped from its peak of roughly $10,391 to a low of roughly $5,969. That is not a short-term dip. The strategy spent the majority of the six-month window in a drawdown that never fully recovered, as the Calmar Ratio of negative 1.31 makes explicit: more than a dollar of annualised loss for every dollar of peak-to-trough decline.
The CAGR of negative 55.71% puts the annualised damage in context. A six-month loss of 33.37% in a consistent direction projects to roughly that figure when extended to a full year. No discretionary trader would tolerate this drawdown profile in a live account.
Why the Stochastic Alone Is Not Enough
The Stochastic oscillator was designed to identify relative extremes in price, not absolute direction. It functions well in sideways or oscillating markets where prices revert after reaching extremes. In a sustained trending environment, oversold conditions can remain oversold for weeks. The indicator keeps firing signals, and each one enters into a worsening position.
The missing element here is a trend filter. Adding a condition that requires ETH to trade above its 200-day moving average before any long entry fires would prevent the strategy from buying into an ongoing downtrend entirely. The expected impact is fewer total trades, but a dramatically higher win rate on those that do trigger, because each entry would align with the broader market structure rather than working against it.
A second adjustment worth testing is a hard stop loss at the trade level. The worst trade in this backtest lost $3,258.65 without a fixed exit to contain it. A stop set at 10% to 15% of trade value would cap that loss at a fraction of the current average loss and shift the payoff ratio considerably.
Both modifications are testable on CoinQuant without writing code. Type the adjusted conditions into the AI strategy builder, re-run the backtest on the same six-month window, and compare the revised Sharpe and Profit Factor directly against these baseline figures.
What This Result Is Actually Worth
Publishing a negative result is a deliberate choice. A 60.7% win rate on a losing strategy is one of the most common traps in systematic trading because win rate is the number that gets shown in screenshots and strategy marketing. The Profit Factor and payoff ratio are the numbers that determine whether a strategy is actually viable.
The Stochastic oscillator is a legitimate tool. This specific configuration, long-only with no trend filter and no stop loss applied in a downtrending ETH market, is not a deployable strategy at these settings. The metrics give precise targets for what improvement looks like: Profit Factor above 1.0, payoff ratio above 1.0, and a Sharpe above zero. Getting there requires either a trend filter, a tighter exit, or both.
That is what backtesting is built for: identifying the specific parameters where an indicator's signal outweighs the conditions working against it, before any real capital follows the idea into live markets.
Disclaimer:
This content is for educational and informational purposes only and does not constitute financial, investment, or trading advice. All strategies and examples are for illustrative purposes and do not guarantee results. Always conduct your own research before making financial decisions.
Key Takeaway