Solana Strategy Backtest: RSI Recovery After the 2026 TVL Crash
.png)
Solana's total value locked collapsed from $13.1B to $5.5B in early 2026, a drop of more than 58% in a matter of months. For a trader watching that selloff, the question is obvious: at some point, is the asset oversold enough to bounce? The RSI oversold recovery strategy is one of the most widely used approaches for identifying those potential turning points. This solana trading strategy backtest 2026 tests that idea honestly against real market data, from 2026-02-22 to 2026-06-22, on SOLUSDT at the four-hour timeframe. The result is instructive, but not in the way a bull might hope.
The Strategy: What It Tests
The RSI oversold recovery strategy is a classic mean-reversion approach. The idea is that when an asset sells off hard enough to push the RSI(14) below 30, it has likely overshot to the downside. When the RSI then closes back above 30, that is treated as a signal that selling pressure is fading and a recovery may be starting.
The exact rules tested here:
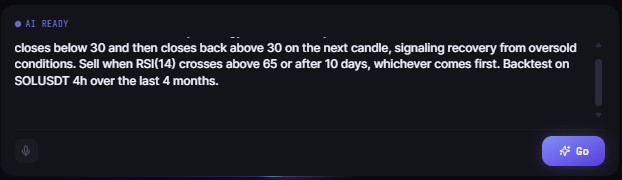
Entry: Buy SOLUSDT on the four-hour chart when RSI(14) closes below 30 and then closes back above 30 on the following candle.
Exit: Sell when RSI(14) crosses above 65, or after 10 days from entry, whichever comes first.
Starting capital: $10,000
Fees modelled: 0.1% taker per trade (Kaiko institutional data, Binance feed)
This is a long-only, no-leverage strategy. No short positions, no complex filters, no trend qualifier. The intent is to test the bare RSI recovery signal in isolation, which is how many traders actually use it.
Full Backtest Results
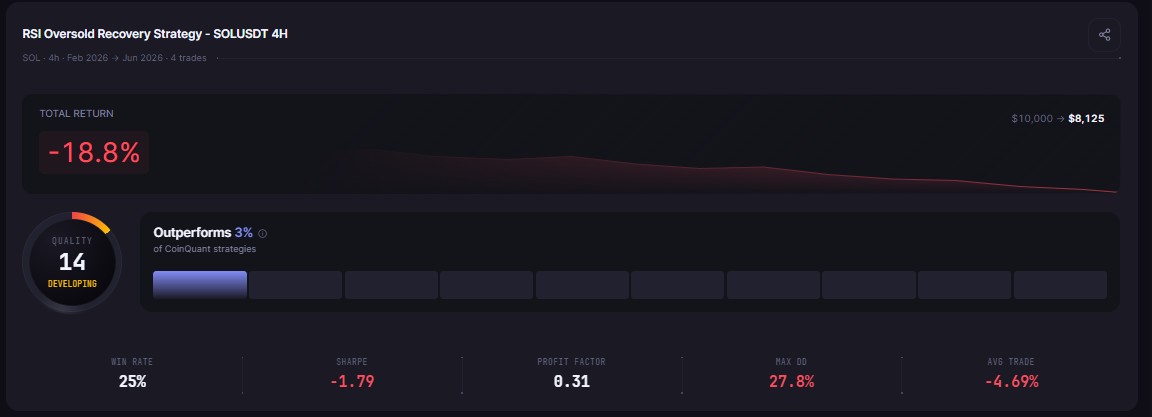
The strategy ran from 2026-02-22 to 2026-06-22, covering four months of the Solana TVL crash period. Here are the complete metrics returned by CoinQuant's backtesting engine:
What the Numbers Say
The headline result is a loss of $1,875.09 on a $10,000 account, a -18.75% drawdown over four months. Annualised, the CAGR projects to -46.8%, which makes this one of the clearest underperformances a simple mean-reversion strategy can produce.
The Sharpe Ratio of -1.79 confirms it: the strategy generated negative risk-adjusted returns. A Sharpe below zero means the strategy would have been outperformed by holding cash. The Sortino Ratio of -0.79 and the Calmar Ratio of -1.69 tell the same story from different angles.
The Profit Factor of 0.31 is particularly stark. A Profit Factor below 1.0 means the strategy lost more than it made in gross terms, and 0.31 means that for every $1 earned, it lost approximately $3.23. There is no edge here.
The single worst trade of -$2,048.01 is the defining data point. Four trades fired, and one of them erased more than 20% of the starting capital on its own. The one winning trade returned $824.55. Three losses totalled more than $2,500. The math is clear.
The Core Problem: Oversold Does Not Mean Bottomed
The deeper issue this backtest surfaces is one of market structure. In a sustained downtrend driven by deteriorating fundamentals, RSI below 30 is not a rare extreme. It becomes a repeating condition as the asset makes lower lows.
Solana's TVL halving in 2026 was not a temporary liquidity shock. It reflected a sustained reduction in protocol activity and capital deployment on the chain. In that environment, each new oversold reading is not a recovery signal. It is a fresh confirmation that the downtrend is continuing.
The strategy fired four times over four months, roughly once every three to four weeks. Each signal looked structurally similar: RSI dips below 30, recovers briefly, the entry triggers. But three of those four entries were followed by further downside, not a sustained recovery. The RSI recovery signal fired correctly in the sense that selling pressure paused, but the fundamental backdrop kept driving new sellers into the market.
This is the oversold trap in a bear trend: the indicator is technically accurate but contextually wrong. Without a trend filter, such as requiring price to be above its 50-period or 200-period EMA before taking a long, the strategy will keep entering long positions into a market that is structurally in distribution.
The Small-Sample Problem
Four trades is not enough to draw conclusions about a strategy's edge. This is not a minor caveat. It is the central statistical reality of this backtest.
Any series of four trades can produce almost any outcome by chance. One extreme winner or loser in a four-trade sample will completely dominate the metrics. In this case, the -$2,048 worst trade accounts for the majority of the total loss. Remove that single trade and the result flips close to breakeven. That is not an argument for ignoring the bad trade. It is an argument for recognising that four trades tells you almost nothing about whether the strategy works or does not work over time.
To build meaningful confidence in a mean-reversion strategy on a four-hour timeframe, you need at minimum 30 trades, and ideally 50 or more, before the metrics carry statistical weight. The correct response to a four-trade backtest is not to trade it, it is to extend the historical window, test on more assets, or adjust parameters to generate a larger sample before drawing conclusions.
The low Time in Market figure of 31.09% adds another layer of caution. The portfolio sat in cash for nearly 70% of the test period. The reported Max Drawdown of 27.75% applies only to the 31% of time the strategy was actually deployed. In practical terms, the capital was at risk for roughly one third of the period and still lost nearly 19% overall.
What This Backtest Teaches
The honest read on this result is not that RSI oversold recovery is a bad strategy in all conditions. It is a strategy that requires a trend-compatible environment to function. In a bull market or a sideways range, RSI recovery signals catch genuine bounces. In a collapsing asset with weakening fundamentals, they become repeated entries into a falling knife.
The key lessons from this four-month test:
Add a trend filter. A 50-period or 200-period EMA above price at entry is the minimum gate for a long-only mean-reversion strategy. Do not go long against a confirmed downtrend.
Require a minimum trade count before trusting results. If a four-month backtest produces fewer than 10 trades, extend the test window or adjust parameters until the sample is statistically meaningful.
Watch for single-trade domination. When one trade accounts for the majority of the loss or gain in a short sample, the strategy has not been stress-tested. Test longer before committing capital.
Low time in market does not mean low risk. A strategy that deploys capital 31% of the time and still draws down 27.75% is taking concentrated risk when it is active, not distributed risk across a full period.
CoinQuant returns all of these metrics automatically on every backtest, including Worst Trade, Time in Market, and Consecutive Losses, so you can apply these filters before deciding whether to take a strategy further.
Disclaimer:
This content is for educational and informational purposes only and does not constitute financial, investment, or trading advice. All strategies and examples are for illustrative purposes and do not guarantee results. Always conduct your own research before making financial decisions.
Key Takeaway