
SOL Breakout Strategy Backtest: Testing Solana Trend-Following Logic Over 15 Months
Breakout logic is the most intuitive idea in trend following: when price breaks above the highest level of the last month, something changed, and the move tends to continue. On Bitcoin and Ethereum, this family of strategies has a long testing history. On Solana, the third-largest crypto asset by market cap, it has mostly been a story told on forums rather than measured.
This article measures it. The test runs a Donchian channel breakout on SOL/USDT, daily timeframe, over 15 months from June 2025 to September 2026, long only, 100% of equity per entry, with a 0.1% taker fee modeled on every trade. The window includes the full trade log, which matters here because 15 months of daily breakout signals is not a lot of trades, and the small sample is itself the most important finding.
The Strategy
SOL Breakout 1D 2025-2026
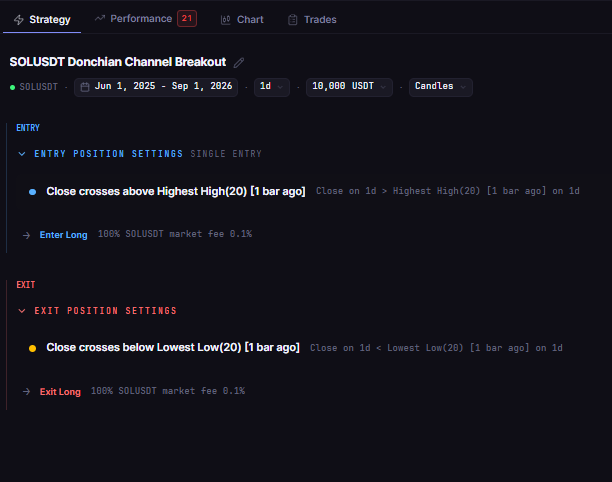
The strategy follows the same definition as the tested Bitcoin and Ethereum breakout strategies in the CoinQuant strategy library:
Entry: close crosses above the highest high of the prior 20 bars (Donchian upper band, period 20)
Exit: close crosses below the lowest low of the prior 20 bars (Donchian lower band, period 20)
The logic is a pure trend follower: it buys new 20-day highs and holds until price gives back the 20-day range. No filters, no indicators, no discretion. Long only, one position at a time.
Test Setup
| Parameter | Value |
|---|---|
| Strategy | SOL Breakout 1D 2025-2026 |
| Instrument | SOLUSDT (spot, Binance) |
| Timeframe | Daily (1D) |
| Tested window | 2025-06-01 to 2026-09-01 (15 months) |
| Entry | Close crosses above Donchian upper band (20) |
| Exit | Close crosses below Donchian lower band (20) |
| Direction | Long only, no leverage |
| Initial capital | $10,000 |
| Position size | 100% of equity per entry |
| Fees | 0.1% taker, modeled |
| Data source | Kaiko via CoinQuant |
The Backtest Results
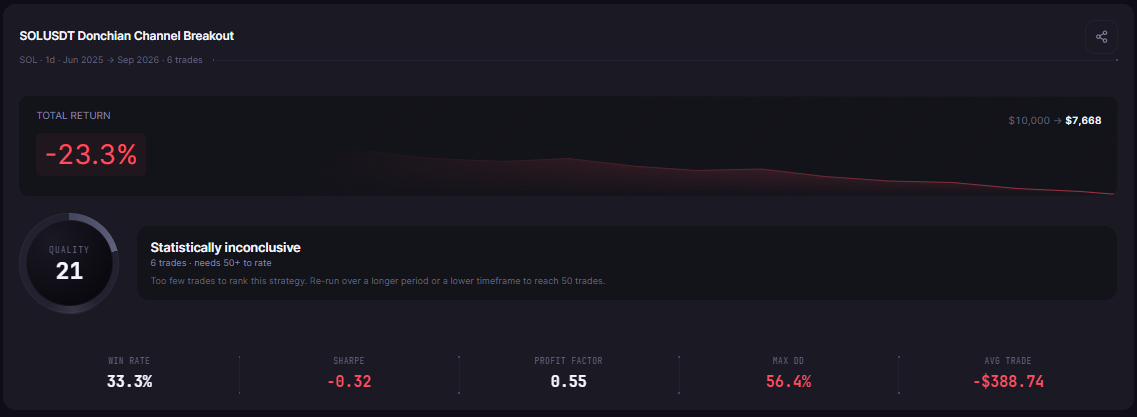
The strategy lost money over the 15 months, and the shape of the loss tells the real story.
| Metric | SOL Breakout 1D |
|---|---|
| Total Return | -23.32% |
| Final Balance | $7,667.56 |
| Total Trades | 6 |
| Win Rate | 33.3% (2W / 4L) |
| Profit Factor | 0.55 |
| Sharpe Ratio | -0.32 |
| Sortino Ratio | -0.45 |
| Max Drawdown | 56.40% |
| Average Win | $1,406.29 |
| Average Loss | $1,286.26 |
| Best Trade | +$1,704.69 |
| Worst Trade | -$1,637.08 |
| Time in Market | 41.05% |
| Total Fees | $105.49 |
The Full Trade Log
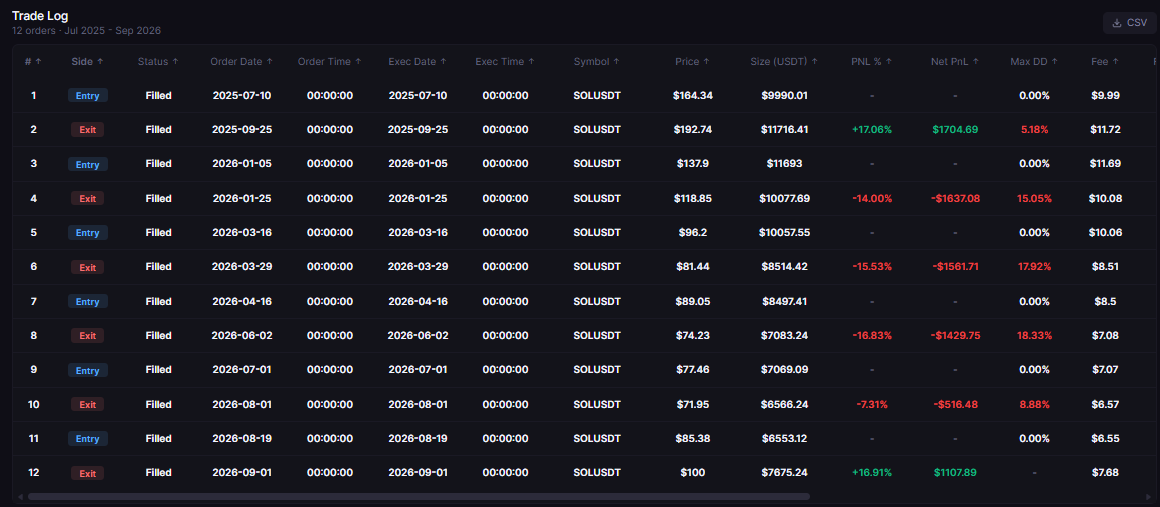
Six trades in 15 months is the first finding: a 20-day Donchian breakout on a single asset is a slow strategy, and 15 months is a short verdict window. The second finding is in what the trades show.
| # | Entry | Exit | Entry Price | Exit Price | Net P/L |
|---|---|---|---|---|---|
| 1 | 2025-07-10 | 2025-09-25 | $164.34 | $192.74 | +$1,704.69 |
| 2 | 2026-01-05 | 2026-01-25 | $137.90 | $118.85 | -$1,637.08 |
| 3 | 2026-03-16 | 2026-03-29 | $96.20 | $81.44 | -$1,561.71 |
| 4 | 2026-04-16 | 2026-06-02 | $89.05 | $74.23 | -$1,429.75 |
| 5 | 2026-07-01 | 2026-08-01 | $77.46 | $71.95 | -$516.48 |
| 6 | 2026-08-19 | 2026-09-01 | $85.38 | $100.00 | +$1,107.89 |
What the Trade Log Shows
The first trade is the pattern the strategy is built for. SOL broke above its 20-day range at $164.34 in July 2025 and ran to $192.74 by late September, a +$1,704.69 win held for 77 bars. That is trend following working as advertised: one decisive move, captured in full.
Then the market changed character. Every subsequent entry came at a lower price: $137.90 in January 2026, $96.20 in March, $89.05 in April, $77.46 in July. The strategy kept buying new 20-day highs inside what was, over the window, a declining market, and each breakout failed. Four losses in a row, each between $516 and $1,637, produced a max drawdown of 56.40% of the account.
The sixth trade is a reminder of how the strategy behaves at the edges. Entered at $85.38 on August 19, it was still open when the backtest window ended, and the engine closed it at the final bar's $100.00 for a +$1,107.89 gain. That trade is real, and it is also why the sample size matters: one swing in the last two weeks of the window moved the total return by roughly 11 percentage points.
Why the Sample Size Is the Finding
A 33.3% win rate on six trades is not a statistical statement about breakout logic on Solana. It is a description of one 15-month window in which Solana traded down and a slow trend follower kept getting stopped out. The drawdown of 56.40% is similarly fragile: with six trades, a single winner becoming a loser would change the picture completely.
The honest reading is structural: a 20-day breakout on daily SOL generates roughly one signal every two to three months. Deciding whether the logic has an edge on Solana requires either a longer window or a faster timeframe, which is exactly what a research workflow is for. The 15-month result is evidence about this window, and the framework for the next test.
The Practical Lesson
SOL Breakout 1D lost 23.32% over 15 months on daily SOL, with a 56.40% max drawdown and a 33.3% win rate on six trades
The one winning trend trade (+$1,704.69, held 77 bars) is the strategy working as designed, and the four losing breakouts are the strategy buying into a declining market
Six trades is too small a sample to call either way, which is itself the actionable finding: test a longer window or an intraday timeframe before drawing conclusions
Fees were not the story here ($105.49 on $10,000), the sequence of failed breakouts was
The Solana breakout question is not settled by 15 months of data, and this article is explicit about that. What the window shows is a strategy that works exactly as designed in a trending phase and pays for it during a declining one. The next step is a longer Solana window or a faster timeframe, each needing its own verified backtest before it earns a place in a live strategy.
Test SOL breakout logic on longer windows and your own variations. Run SOL backtests free on CoinQuant
Disclaimer:
Key Takeaway
