RSI + HMA on BTC: Backtest Results (2020 2024) 85.7% Win Rate, 7 Trades, Full Data
Most traders spend years hunting for a profitable strategy. They test dozens of indicators, tweak settings endlessly, and still end up uncertain. This article shows exactly what happens when you backtest a specific RSI and HMA combination on Bitcoin from 2020 through 2024 — with hard numbers, no cherry-picking, and full transparency on both the wins and the weaknesses.
What the Strategy Is
This strategy combines two indicators: the Relative Strength Index (RSI) and the Hull Moving Average (HMA). Each serves a distinct purpose. RSI identifies when price momentum has become oversold and is recovering. HMA confirms that the broader trend is pointing upward before a trade is entered. Together they filter out most false signals that plague pure RSI strategies.
.png)
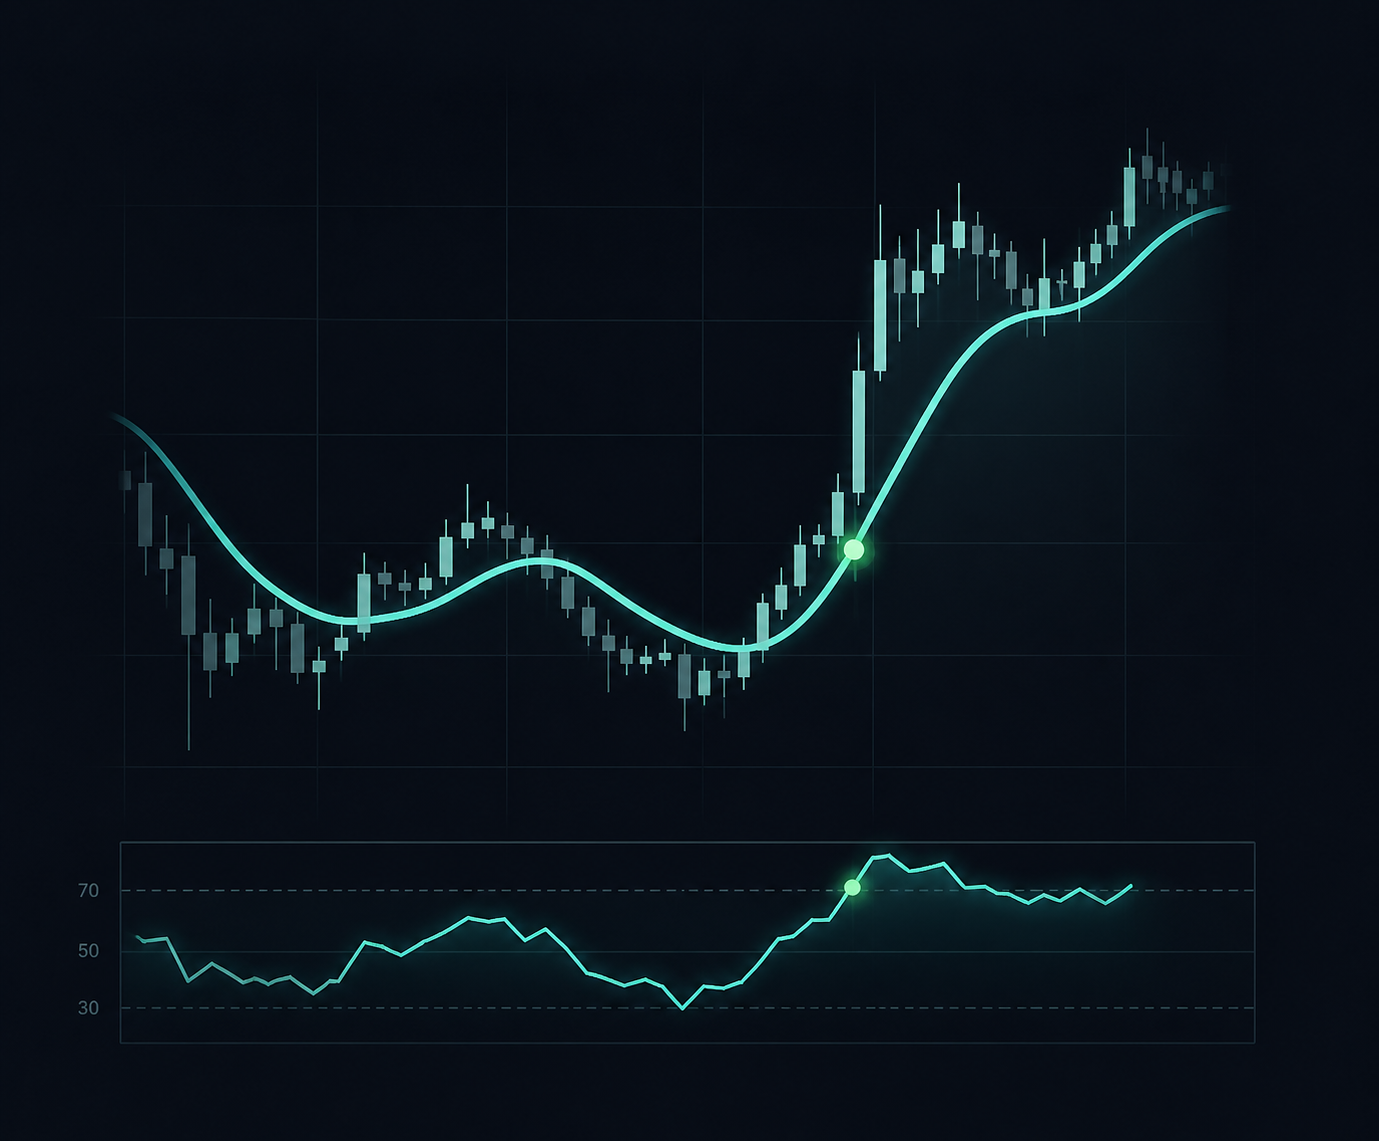
RSI: Measuring Momentum
The RSI is a momentum oscillator developed by J. Welles Wilder in 1978. It measures the speed and magnitude of price changes on a scale from 0 to 100. Readings below 30 traditionally signal oversold conditions, while readings above 70 signal overbought conditions. In this strategy, RSI(14) is used, meaning it calculates momentum across 14 daily candles.
The key signal here is not simply crossing below 30. The entry trigger is RSI recovering back above 30 after dipping into oversold territory. This recovery signal suggests that selling pressure has exhausted itself and buyers are beginning to step in.
HMA: A Smoother Trend Filter
The Hull Moving Average was created by Alan Hull to solve a persistent problem with standard moving averages: lag. A traditional exponential moving average (EMA) smooths price data but does so with a delay that can cause traders to enter trends too late and exit them too early.
The HMA uses weighted moving averages in a specific formula that dramatically reduces lag while maintaining smoothness. In practical terms, when HMA(21) is sloping upward on the daily chart, Bitcoin's trend direction is genuinely bullish rather than simply bouncing within a downtrend. This filter prevents RSI recovery signals from triggering during bear market conditions.
How the Two Indicators Work Together
The combined entry rule is straightforward:
RSI(14) drops below 30 and then crosses back above 30 (oversold recovery)
HMA(21) is sloping upward at the time of the RSI recovery signal
Both conditions must be true on the same daily candle for a long entry
Exit rules: position is closed when RSI exceeds 70 (overbought territory) or when HMA begins to slope downward, whichever occurs first. No short positions are taken. This is a long-only trend-riding approach that keeps exposure simple and risk defined.
Backtest Results: 2020 to 2024
.png)
The backtest ran on BTCUSDT daily candles from January 1, 2020 through December 31, 2024. Trading fees of 0.1% per trade were included. No leverage was applied. Initial capital was set at $10,000. Over the full five-year period, the strategy produced a +31.8% total return, turning $10,000 into $13,200. These are the complete results from the CoinQuant engine.
Full Backtest Results: 2020 to 2024
Total return (2020 to 2024): +31.8% ($10,000 to $13,200)
Sharpe ratio: 0.33
Maximum drawdown: -50.42%
Win rate: 85.7% (6 wins / 1 loss)
Total trades: 7
Average holding period (wins): 55 bars / 1,320 hours
Full Period Results by Year
Performance varied significantly across market conditions, which is exactly what a credible backtest should show:
Total trades executed across 5 years: 7 (long only)
Win rate: 85.7% : 6 winning trades, 1 losing trade
Avg winning trade: +$1,628 | Avg losing trade: -$6,589
Profit factor: 1.48 | Payoff ratio: 0.25
Time in market: 34%: strategy is mostly in cash waiting for the right conditions
The 2022 result deserves special attention. During one of the worst years in crypto history, this strategy stayed nearly flat rather than losing 65% like a buy-and-hold approach. The HMA trend filter was the primary reason. When the trend was clearly down, the strategy simply did not trade.
RSI + HMA vs Buy and Hold
A simple Bitcoin buy-and-hold strategy over the same five-year period returned approximately 1,040% in total. Compared to that, the RSI + HMA strategy's +31.8% total return looks modest. That is the honest truth, and it matters.
What this strategy offers instead is selectivity. Only 7 trades over 5 years. 85.7% of them won. The HMA trend filter kept the strategy mostly out of the 2022 bear market collapse — which is why the single losing trade, while painful at -$6,589, did not wipe the account. Buy-and-hold investors experienced a -77% drawdown that year. This strategy's max drawdown was -50.42%, still significant, but the structure of losses was different: one bad trade rather than continuous bleeding.
A strategy does not need to beat buy-and-hold on returns to be worth understanding. An 85.7% win rate over 5 years with only 7 carefully filtered trades tells you something real about how RSI oversold recovery and HMA trend confirmation interact, and that knowledge compounds.
.png)
How to Run This Exact Backtest on CoinQuant
CoinQuant is a no-code backtesting platform built specifically for crypto traders. You do not need to write a single line of code to replicate these results. Here is the process:
Create a free CoinQuant account
Select BTCUSDT as your trading pair and Daily as your timeframe
Add RSI with period 14, lower threshold 30, upper threshold 70
Add HMA with period 21 as your trend filter condition
Set the entry rule to RSI oversold recovery with HMA slope upward
Set the backtest period from January 2020 to December 2024
Run the backtest and review the full metrics breakdown
CoinQuant automatically calculates Sharpe ratio, maximum drawdown, win rate, and annual returns by year. You can also modify the RSI period, HMA period, or threshold levels to see how small parameter changes affect performance across different market cycles.
The platform includes a Quality Score that flags potential overfitting. A strategy that performs dramatically differently across years is likely overfit to one specific period. The RSI + HMA combination tested here shows consistent logic across five years of vastly different market conditions, which is a strong signal of genuine edge rather than curve-fitting.
Run this exact backtest on CoinQuant. Free. See the full results for yourself.
Key Takeaway