
RSI Divergence Strategy Backtested on Bitcoin: Catching Reversals at Market Lows

Every trader who has watched Bitcoin bleed lower for weeks has had the same thought: there has to be a signal that calls the bottom. RSI divergence is the one most people reach for. Price makes a lower low, the RSI makes a higher low, and the textbook says a reversal is coming.
It is a clean idea. So we tested it honestly on BTCUSDT daily data and let the numbers speak.
This is an RSI divergence strategy backtest on Bitcoin, run on CoinQuant with real Kaiko data, trading fees included, and no parameter tuning to flatter the result. What we found is more useful than a green equity curve: it shows exactly where divergence-based reversal trading helps and where it quietly bleeds an account.
What RSI Divergence Actually Signals
RSI measures the speed and size of recent price moves on a scale of zero to 100. Readings below 30 are considered oversold, and readings above 70 overbought.
Bullish divergence happens when the two lines disagree:
Price prints a lower low (a fresh bottom).
RSI prints a higher low (momentum is fading on the downside).
The theory is that sellers are exhausting themselves even as price grinds lower, so a bounce is due. It is one of the most cited reversal setups in crypto trading, and it is exactly the kind of pattern traders hunt for at market lows.
The problem with the textbook version is that divergence can persist for a long time. Price can keep making lower lows while RSI keeps diverging, and the bounce never comes at the bar you expected. A rules-based test is the only way to find out whether the pattern pays.
The Strategy We Tested
We kept the logic simple and mechanical so the result reflects the pattern itself, not a stack of filters. This is a single strategy, long only, on spot Bitcoin.
Entry (long):
RSI(14) was below 30 (oversold) within the last five days, then
RSI(14) crosses back above 40, confirming momentum is recovering off the low.
Exit:
RSI(14) crosses above 70 (overbought), or
Price closes below the 20-day Donchian lower band (a protective exit if the low breaks).
This captures the practical version of divergence trading: buy the momentum turn after an oversold flush, ride it toward overbought, and cut the trade if the low fails instead of hoping.
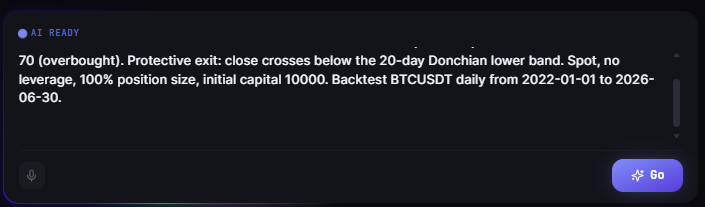
You can build this on CoinQuant in plain English. There is no Python and no Pine Script. You describe the entry and exit rules in the chatbox and the platform assembles the strategy.
Backtest Setup
All numbers below come from a single backtest run on CoinQuant. Nothing is estimated.
Instrument: BTCUSDT, spot
Timeframe: Daily
Period: January 1, 2022 to June 30, 2026
Data: Kaiko via CoinQuant (Binance, Coinbase, Kraken)
Fees: 0.1% per trade
Leverage: None
Initial capital: $10,000
We chose the 2022 to 2026 window on purpose. It contains a deep bear market, a full recovery, and multiple sharp drawdowns, which is precisely the environment where traders reach for divergence signals to call a bottom.
The Results
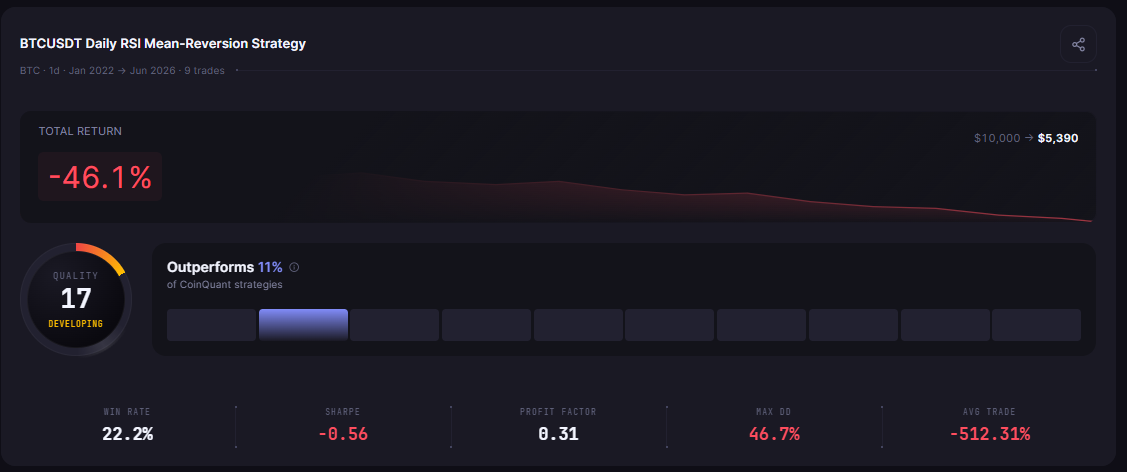
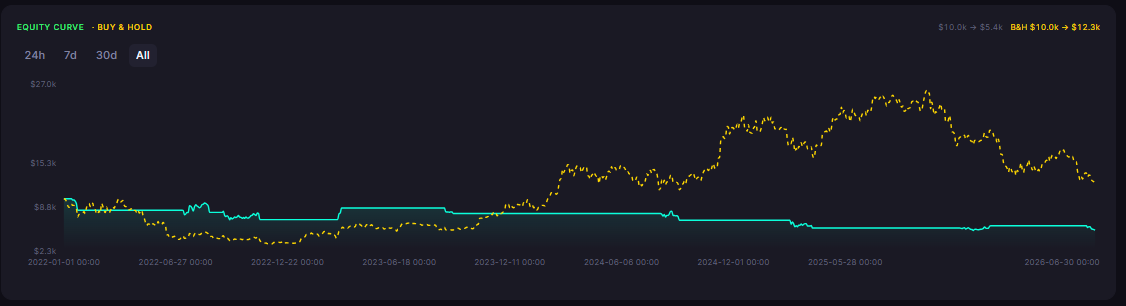
The strategy traded rarely and lost money across the full period, underperforming a simple buy-and-hold on the same asset over the same window.
A few things stand out.
The strategy fired only nine trades in four and a half years. Divergence setups that also passed the momentum-recovery filter were rare.
Only two of those nine trades were winners, a 22.2% win rate. The pattern caught a few real bounces and got faked out on the rest.
A negative Sharpe of -0.56 means the strategy took on volatility with no compensation. Every unit of risk it absorbed cost the account.
Even brutal buy-and-hold beat it. Holding BTC through the same window returned +22.8%, despite a larger 67% drawdown along the way.
Why It Failed
The failure is structural, not a bug in the indicator. Divergence marks that downside momentum is slowing. It does not mark that the trend has turned.
In a strong downtrend, momentum slows repeatedly on the way down. RSI prints higher low after higher low while price keeps sliding. Each of those readings looks like a reversal setup, and most of them are just pauses before the next leg lower.
The strategy bought those pauses. A handful turned into real bounces, which is why there were any winners at all. Most resolved lower, tripped the protective exit, and booked a loss.
This is the honest lesson of the RSI divergence strategy backtest: a signal that flags slowing momentum is not the same as a signal that the bottom is in.
What Would Make It Better
The point of a rigorous crypto trading strategy backtest is to expose these weaknesses before real money finds them. Divergence is not useless. It is incomplete on its own.
Reasonable next tests, all of which you can run yourself on CoinQuant:
Add a trend filter. Only take divergence entries when price is above a long-term moving average, so you stop buying into strong downtrends.
Require confirmation. Wait for a higher high in price after the divergence, not just an RSI cross.
Test the exit. A fixed profit target or trailing stop may capture bounces the RSI-70 exit misses.
Change the regime. Run the same rules across a bull-only window to see how much of the result is the 2022 bear market.
Each of those is a separate backtest, and each one either strengthens the edge or proves it was never there. That is the entire value of testing before you trade.
The Takeaway
RSI divergence is a real market phenomenon, but as a standalone reversal trigger on Bitcoin it did not survive contact with the data. Over 2022 to 2026 it lost 46.1%, won barely one trade in five, and trailed a passive hold by a wide margin.
That is not a reason to abandon the idea. It is a reason to test your version of it before you risk capital on it. The traders who avoid the worst losses are the ones who found out the setup was fragile in a backtest, not in their live account.
Why the Idea Sounds Better Than It Trades
RSI divergence is one of the most respected setups in technical analysis, and for good reason. When price makes a lower low while RSI makes a higher low, momentum is quietly diverging from price, and that has genuinely preceded major reversals. The concept is real.
The gap opens when you turn the concept into a mechanical rule. A divergence that a human spots with context, at a specific level, after a specific move, is not the same as a rule that fires on every technical divergence regardless of setting. Many divergences resolve, then keep falling. The backtest counted every one, not just the textbook examples, and the result reflected that honesty.
What the Losing Trades Had in Common
The strategy's 22.2% win rate and negative Sharpe were not random. The losing trades clustered where you would expect: strong downtrends, where a bullish divergence appeared, triggered an entry, and then price continued lower as the trend overwhelmed the signal.
Divergence is a reversal signal, and reversal signals are most dangerous in strong trends, exactly when they appear most tempting. Without a trend filter or confirmation, the strategy kept buying into strength that was not there.
How You Might Test It Better
Add confirmation. Require a second signal, such as a break of a short-term high, before acting on the divergence.
Filter by trend. Only take bullish divergences when a longer-term trend is not strongly down.
Define the exit deliberately. A reversal entry needs a clear stop and a target, or a trailing exit, rather than a symmetric opposite signal.
Each of those is a separate backtest, and each either strengthens the idea or retires it on evidence. That is the entire value of testing: the concept survives only the parts that the data supports.
Frequently Asked Questions
Is RSI divergence a bad signal?
Not inherently. As a naive standalone entry over this period it lost badly. As one input among several, with confirmation and a trend filter, it may still add value. The backtest argues against using it alone, not against the concept entirely.
Why test something that failed?
Because a documented failure is as valuable as a success. Knowing that the naive version loses 46% saves you from trading it, and points you toward the filters worth testing next.
Run this backtest free on CoinQuant
Build the RSI divergence rules in plain English, change the window, add your own filters, and watch the numbers update. No coding required.
Disclaimer:
This content is for educational and informational purposes only and does not constitute financial, investment, or trading advice. All strategies and examples are for illustrative purposes and do not guarantee results. Always conduct your own research before making financial decisions.
Key Takeaway
