RSI Buy and Sell Signals: How to Identify Them (With Backtest Proof)
.png)
RSI is the most widely used momentum indicator in trading. It is on every charting platform, taught in every course, and drawn on every crypto trader's screen. And most of them are using it wrong, or at least incompletely.
This article fixes that. We cover what RSI buy and sell signals are, walk through the classic 30/70 setup, and then run a real backtest on BTCUSDT from 2017 to 2024 to see whether these signals hold up.
What Is the RSI?
The Relative Strength Index (RSI) is a momentum oscillator developed by J. Welles Wilder Jr. in 1978. It measures the speed and magnitude of recent price changes on a scale from 0 to 100.
The formula compares average gains to average losses over a lookback period. The default is 14 candles. When price rises sharply, RSI climbs toward 100. When price sells off hard, RSI drops toward 0.
Classic RSI Buy and Sell Signals
Wilder defined two zones that traders use as entry and exit triggers. The logic is straightforward: when price has fallen fast enough to push RSI into oversold territory, a bounce is more likely. When RSI hits overbought, the rally may be running out of steam.
RSI drops below 30 → Oversold zone → Potential buy signal
RSI rises above 70 → Overbought zone → Potential sell signal
Many traders refine this by waiting for RSI to cross back through the threshold, buying when RSI crosses back above 30 (confirming recovery) rather than the moment it dips below. This filters out some false signals.
Do RSI Signals Actually Work on Crypto?
Crypto is not stocks. Higher volatility, 24/7 markets, and thinner liquidity mean RSI behaves differently here. During a bear market, RSI can stay oversold for weeks. During a bull run, it can stay overbought for months.
Before building a strategy around RSI signals, you need data. Here's what a systematic backtest actually shows.
Backtest: RSI 30/70 on BTCUSDT (2017–2024)
Strategy setup:

Results:

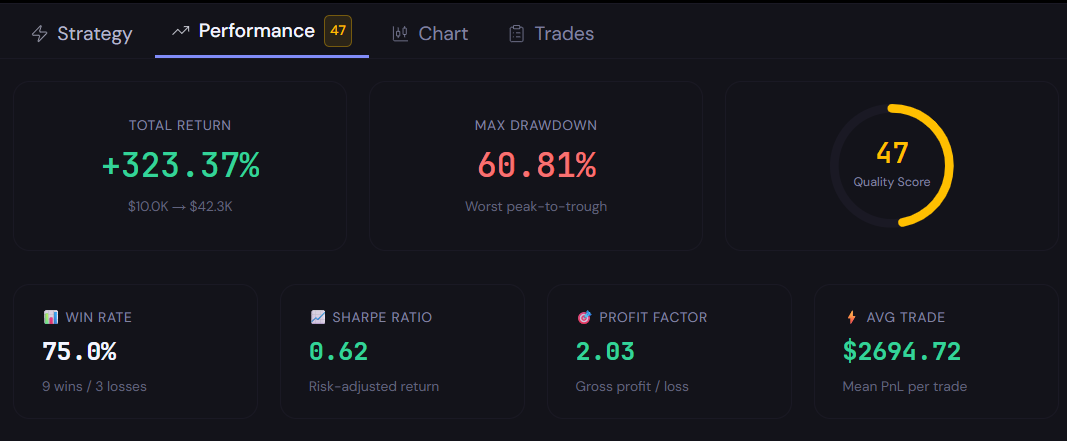
What the Backtest Tells Us
The RSI 30/70 strategy on BTC/USDT from 2017 to 2024 returned +323.4%, turning $10,000 into $42,337. That is a solid absolute return across any eight-year window. But a simple Bitcoin buy-and-hold over the same period returned +9,179.9%, turning $10,000 into over $927,000. The RSI strategy did not just underperform, it was left behind by a factor of 22×.
The win rate of 75.0% sounds respectable, nine winning trades out of twelve. But the numbers hide a deeper problem: the average win ($7,082) is only 68% of the average loss ($10,468), giving a payoff ratio of 0.68. You win more often than you lose, but a single losing trade erases about 1.5 winning trades. Worse, RSI 30/70 cross signals on daily data are extremely infrequent. Only twelve trades over nearly eight years means you are sitting in cash the majority of the time while Bitcoin compounds.
The profit factor of 2.03 confirms the strategy captures real edges, it generates about $2 in gross profit for every $1 in gross losses. But the Sharpe ratio of 0.62 and max drawdown of -60.8% tell a more sober story. Risk-adjusted returns are below the 1.0 threshold most systematic traders require. And a 60% drawdown means an investor who started at the worst moment waited nearly seven years to recover. The worst trade alone lost $16,839 on a single signal. RSI 30/70 as a pure entry/exit system on crypto is a starting point, not a finished edge.
How to Improve RSI Signals
Five adjustments that meaningfully improve RSI signal quality on crypto:
Trend filter: Only take RSI buy signals when price is above the 200-day MA. Avoids bottom-catching in bear markets.
Wider thresholds: Try 20/80 instead of 30/70 on crypto. Reduces false signals during strong trends.
Multi-timeframe confirmation: Confirm a daily RSI signal with 4H RSI alignment before entering
Volume confirmation: RSI signal + above-average volume = higher conviction entry; RSI signal + low volume = skip
RSI divergence: Price makes a new low but RSI does not. This is a stronger reversal signal than threshold crosses alone.
How to Test RSI Signals on CoinQuant
You don't need to code any of this. CoinQuant's no-code Strategy Builder lets you run custom RSI backtests in under a minute:
Sign in at CoinQuant
Open the Strategy Builder
Select your asset (e.g., BTCUSDT) and timeframe
Add the RSI indicator with your chosen period (default: 14)
Set your entry rule: RSI crosses below 30 (or your custom threshold)
Set your exit rule: RSI crosses above 70 (or your custom threshold)
Click Run Backtest. Get the full performance report instantly.
The real value comes from testing variations and adding filters before risking capital. A trend filter, adjusted thresholds, or multi-timeframe confirmation can meaningfully change the outcome. Run the numbers first. That is exactly what CoinQuant is built for.
Conclusion
RSI buy and sell signals are directionally right, a 75% win rate and 2.03 profit factor do not happen by accident. The strategy identified enough profitable swings to more than triple the initial capital. But a Sharpe of 0.62, a payoff ratio below 0.7, and a total return that trails the baseline by over 20× means the classic 30/70 setup alone is not enough. RSI is better used as a confirmation tool than a standalone system. Add a trend filter, test wider thresholds, and confirm across timeframes ,then backtest the result before you risk a dollar.
That is the difference between traders who follow indicators and traders who know whether those indicators actually work.
Ready to test your RSI setup? Backtest RSI signals on CoinQuant. Free. Get your backtest results in under 60 seconds.
Disclaimer:
This content is for educational and informational purposes only and does not constitute financial, investment, or trading advice. All strategies and examples are for illustrative purposes and do not guarantee results. Always conduct your own research before making financial decisions.
Key Takeaway