MACD + RSI on ETH: Backtest Results That Might Surprise You
%2520(1).png)
Combining MACD and RSI is one of the most popular approaches discussed in crypto trading forums. The logic sounds airtight: use RSI to gauge whether momentum is stretched, then use a MACD crossover to confirm the trend is turning before entering. Two signals should be safer than one. We put that assumption to the test with a six-year backtest on Ethereum. The macd rsi combo strategy backtest produced a clear, uncomfortable answer: on ETH, stacking these two momentum indicators did not protect capital. It lost more than half of it.
The Strategy Setup
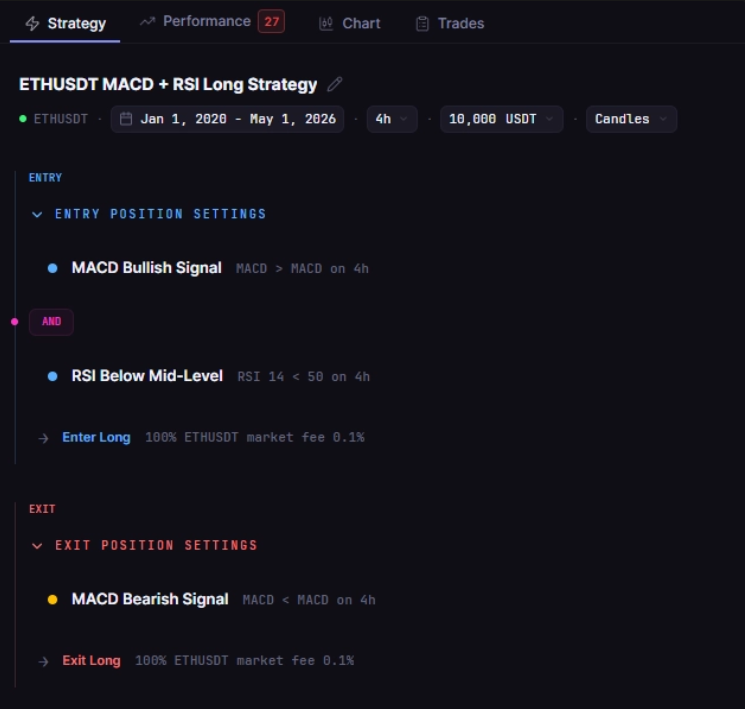
This macd rsi combo strategy backtest pairs a momentum trigger with a regime filter so the system only buys when momentum turns up while RSI is not already stretched to the top of its range.
Asset: ETHUSDT (Binance Spot)
Timeframe: 4-hour candles
Entry: MACD(12,26,9) line crosses above the signal line AND RSI(14) is below 50
Exit: MACD(12,26,9) line crosses below the signal line
Test period: January 1, 2020 to May 1, 2026
Initial capital: $10,000
Fees: 0.1% maker and 0.1% taker, applied to every trade
Data source: Kaiko via CoinQuant
Backtest Results
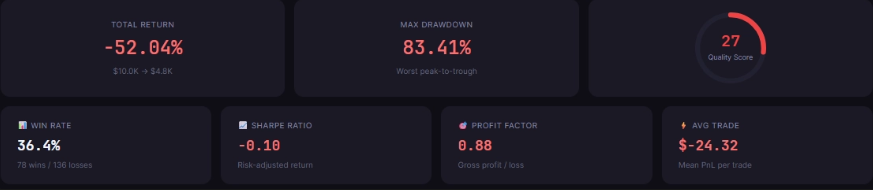
Results from the CoinQuant backtest engine on ETHUSDT, January 2020 to May 2026, pulled directly from the API:
Why the Results Might Surprise You
Most traders assume more conditions equal a better filter. This MACD RSI combo strategy backtest is a clear example of where that assumption breaks down on Ethereum.
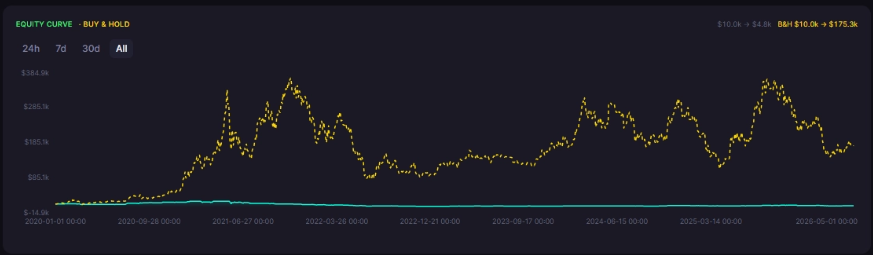
The strategy traded often: 214 entries across six years, roughly one every eleven days. That is more than enough activity to judge the approach on its merits, and the verdict is harsh. A 36.4% win rate means the system was wrong on nearly two of every three trades. The 83.41% maximum drawdown is the number that should stop any trader cold. At its worst, a $10,000 account following this strategy would have fallen to under $1,700 in open equity before recovering. No realistic trader holds through a drawdown that deep.
The core failure is structural. MACD crossovers fire constantly on the 4-hour timeframe, including during the long, grinding downtrends that define ETH bear phases. Filtering those signals with RSI below 50 does not help, because in a downtrend RSI spends most of its time below 50 anyway. The filter lets nearly every MACD buy signal through, so the strategy keeps buying into falling prices and exiting after the next adverse cross. The combination does not add discrimination. It adds whipsaw.
What This Tells You About Combining Indicators
The lesson from this macd rsi combo strategy backtest is not that MACD is useless or that RSI is useless. It is that bolting two momentum indicators together does not create a trend filter. Both MACD and RSI measure momentum, so they tend to agree and disagree at the same times. Stacking them gives the illusion of confirmation without adding independent information.
A more effective approach pairs a momentum trigger with something that measures a different dimension of the market, such as a longer-term trend filter or a volatility-based tool. As a reference point, a trend-following ATR-based strategy (Supertrend) on ETH over a similar window produced a strongly positive result on CoinQuant, because it stays out of the chop that wrecked this MACD plus RSI system. The takeaway from this macd rsi combo strategy backtest is to test the actual numbers rather than trust the intuition that two indicators must be better than one.
How to Run This Macd Rsi Combo Strategy Backtest Yourself
CoinQuant's no-code strategy builder lets you configure and test any MACD and RSI combination in minutes. No Python, no Pine Script.
Create a free account on CoinQuant.
Open the Strategy Builder and select ETHUSDT on the 4H timeframe.
Add MACD(12,26,9) and set the entry: MACD line crosses above the signal line.
Add RSI(14) and require RSI below 50 on entry.
Set the exit: MACD line crosses below the signal line.
Set fees to 0.1% maker and taker, and the window to January 2020 through May 2026.
Run the macd rsi combo strategy backtest and review the results instantly.
From there, test variations that add a genuinely independent filter: a 200-period moving average trend gate, a volatility threshold, or a wider RSI band. Every run uses the same Kaiko institutional data and completes in seconds, so you can find out what actually works before risking a dollar.
Test MACD + RSI combos on CoinQuant
Disclaimer:
This content is for educational and informational purposes only and does not constitute financial, investment, or trading advice. All strategies and examples are for illustrative purposes and do not guarantee results. Always conduct your own research before making financial decisions.
Key Takeaway