
MACD Histogram Strategy Backtest on BNB: Testing Entry Signals Over 12 Months

Most MACD traders use the classic signal: the MACD line crossing its signal line. The MACD histogram tells a slightly different story. The histogram is the distance between those two lines, and its sign flips at exactly the same moment as the classic cross. What the histogram adds is a measure of how fast momentum is shifting, which is why many traders read histogram turning points rather than line crosses.
This article tests the pure histogram version: enter long when the histogram crosses above zero, exit when it crosses below zero, on BNB/USDT daily over 12 months from September 2025 to September 2026. The benchmark is a buy-and-hold position over the same window, which matters because the 12 months turned out to be a falling market for BNB, and a momentum strategy's real test is what it does with its capital when the asset is not going up.
The Two Strategies
BNB MACD Histogram 1D 12M
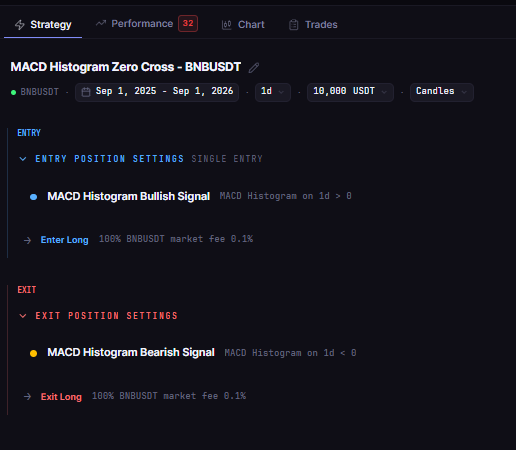
The strategy uses MACD with standard settings (fast 12, slow 26, signal 9, exponential smoothing). The histogram is the MACD line minus the signal line.
Entry: histogram crosses above 0, meaning momentum has flipped from bearish to bullish
Exit: histogram crosses below 0, meaning momentum has flipped back
The strategy is long only, one position at a time, 100% of equity per entry, 0.1% taker fee modeled. Between signals it sits in cash, and that cash behavior is the entire point of the comparison.
BNB Buy and Hold 1D 12M
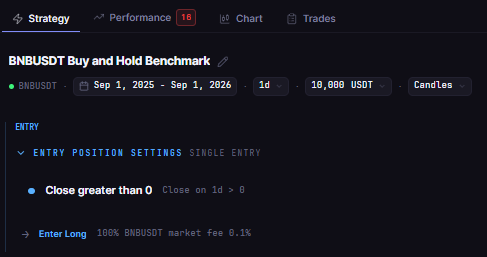
The benchmark buys at the market on the first bar of the window and holds to the final bar. Same 0.1% fee model, same initial capital. It answers the question every momentum backtest needs answered: what did simply owning BNB do over the same 12 months?
Test Setup
| Parameter | MACD Histogram | Buy and Hold |
|---|---|---|
| Strategy | BNB MACD Histogram 1D 12M | BNB Buy and Hold 1D 12M |
| Instrument | BNBUSDT (spot, Binance) | BNBUSDT (spot, Binance) |
| Timeframe | Daily (1D) | Daily (1D) |
| Tested window | 2025-09-01 to 2026-09-01 | 2025-09-01 to 2026-09-01 |
| Entry | MACD histogram crosses above 0 | Market, first bar of window |
| Exit | MACD histogram crosses below 0 | Market, final bar of window |
| Direction | Long only, no leverage | Long only, no leverage |
| Initial capital | $10,000 | $10,000 |
| Position size | 100% of equity per entry | 100% of equity |
| Fees | 0.1% taker, modeled | 0.1% taker, modeled |
| Data source | Kaiko via CoinQuant | Kaiko via CoinQuant |
The Backtest Results
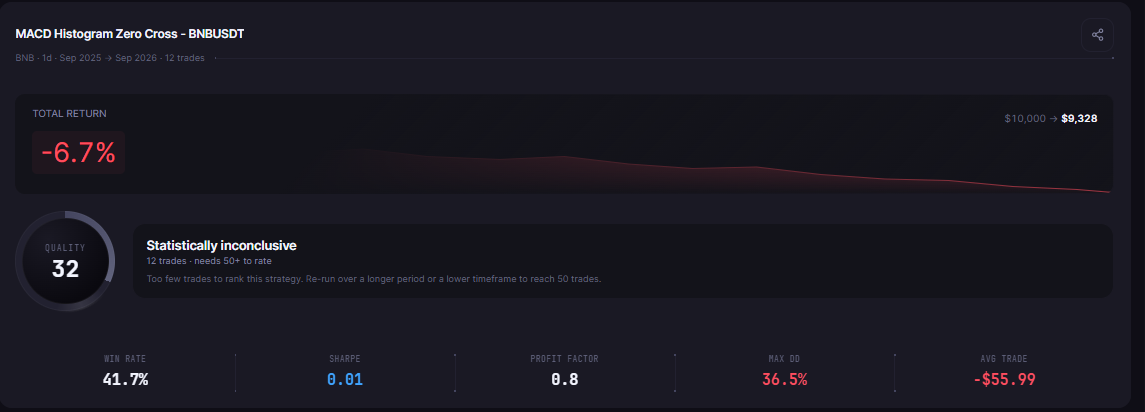
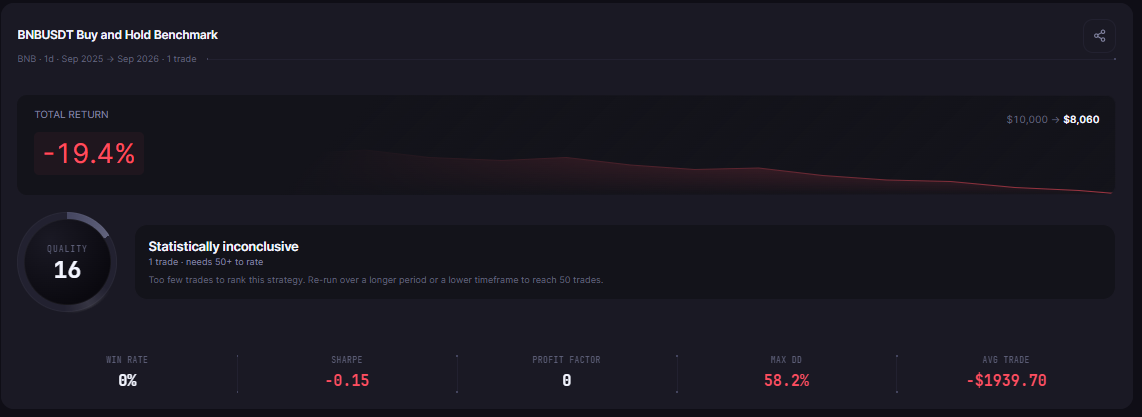
The window was a losing one for BNB itself: buy and hold returned -19.40%. The MACD histogram strategy lost 6.72%, which means it outperformed simply owning the asset by 12.7 percentage points while taking roughly half the drawdown.
| Metric | MACD Histogram | Buy and Hold |
|---|---|---|
| Total Return | -6.72% | -19.40% |
| Final Balance | $9,328.11 | $8,060.30 |
| Total Trades | 12 | 1 |
| Win Rate | 41.7% (5W / 7L) | 0% (0W / 1L) |
| Profit Factor | 0.80 | n/a (no wins) |
| Sharpe Ratio | 0.01 | -0.15 |
| Sortino Ratio | 0.01 | n/a |
| Max Drawdown | 36.46% | 58.20% |
| Average Win | $532.77 | n/a |
| Average Loss | $476.54 | -$1,939.70 |
| Best Trade | +$740.70 | n/a |
| Worst Trade | -$1,403.46 | -$1,939.70 |
| Time in Market | 57.38% | 100% |
| Total Fees | $237.06 | $18.06 |
What the Data Shows
The histogram strategy lost money in absolute terms, and the comparison explains why that is still informative. BNB fell roughly 19.4% across the window, and the strategy's signal structure reacted to that decline by spending 42.62% of its time in cash. It was long only 57.38% of the time, which is the mechanism behind the result: histogram zero-crosses moved the account out of a falling asset during its weakest stretches and back in only when momentum had turned positive.
The outcome is a loss of 6.72% against the market's 19.40%, a relative gain of 12.7 percentage points, with a max drawdown of 36.46% against buy and hold's 58.20%. In a falling market, the histogram strategy did not manufacture profit, it avoided roughly two thirds of the loss and cut the drawdown by more than a third.
The trade structure supports that reading. Twelve round trips in 12 months, 41.7% win rate, average win of $532.77 against average loss of $476.54: the strategy was not catching large trends, it was rotating in and out of a range-bound decline. Its worst trade, -$1,403.46, is the signature of getting caught long when a decline accelerated.
Why the Negative Result Is the Honest Result
An article titled "testing entry signals over 12 months" that found a profitable MACD histogram strategy in a falling BNB market would be suspicious on its face. Momentum strategies are long-biased by construction: they are in the market when momentum is positive, and in a market that spent the year declining, positive momentum windows were brief and shallow.
The honest finding is comparative: histogram zero-cross signals on daily BNB did not beat the market in this window, and they did beat buy and hold by a wide margin because the signal's cash exits preserved capital. Whether that relative performance repeats in a rising market is a different question, and it needs a different window to answer.
The Practical Lesson
BNB buy and hold lost 19.40% over the 12 months, so the benchmark itself was negative
The MACD histogram strategy lost 6.72%, outperforming buy and hold by 12.7 percentage points with a 36.46% drawdown versus 58.20%
The mechanism was time in market: 57.38% versus 100%, with histogram zero-crosses moving capital to cash during the decline
A negative absolute return with a strong relative result is still a verdict, and the next test is the same strategy in a rising BNB window
The MACD histogram question is answered for this window: on daily BNB from September 2025 to September 2026, zero-cross entries did not make money in a falling market, and they preserved capital decisively compared with holding the asset. The natural next step is the same signal set on a rising window, or a trend filter on top of the histogram, each with its own verified backtest before live capital.
Test MACD histogram signals against buy and hold on your own assets and windows. Run it free on CoinQuant
BACKTEST VERIFIED: Article 258 Strategies (both BNBUSDT 1D, 2025-09-01 to 2026-09-01): BNB MACD Histogram 1D 12M (strategy_version_id 3629e1f2-6b20-4a42-ac8e-3563cab13a04, backtest_id e57daed5-4f6d-455b-b25b-93cddeebf390, TR -6.72%, 12 trades, 41.7% win, PF 0.80, DD 36.46%, fees $237.06); BNB Buy and Hold 1D 12M (strategy_version_id 6432d7c9-c147-4963-ae12-cb089e6976a7, backtest_id e1404cda-7e30-4b81-9d4a-79c94c880d03, TR -19.40%, 1 trade, DD 58.20%, fees $18.06). All metrics confirmed via GET /v1/backtests/{id}/results on 2026-09-07.
Disclaimer:
Key Takeaway
