
Ichimoku Cloud Strategy on Bitcoin: 8 Years of Backtest Results
The Ichimoku Cloud is one of the most recognizable indicators on any Bitcoin chart, yet it is also one of the most argued over. Traders either treat the cloud as a complete trading system or dismiss it as visual clutter.
With Bitcoin trading in a defined range through mid-2026, the cloud's signals are back in the spotlight. The question worth answering is simple: does a rules-based Ichimoku strategy actually hold up on Bitcoin over a full market cycle?
This article runs a single Ichimoku Cloud strategy on daily Bitcoin data from 2018 to 2026 and reports the results without adjustment. No cherry-picked window, no smoothed numbers.
What the Ichimoku Cloud Strategy Actually Does
The Ichimoku Cloud (Ichimoku Kinko Hyo) is a multi-component indicator. It combines several moving-average-style lines to describe trend, momentum, and support or resistance in a single view.
The strategy tested here uses the classic settings and the three signals traders reference most often:
Tenkan-sen (9): the fast conversion line
Kijun-sen (26): the slower base line
Senkou Span B (52): the slow boundary of the cloud (Kumo)
The rules are deliberately mechanical:
Entry: price closes above the Kumo cloud, and the Tenkan-sen crosses above the Kijun-sen
Exit: price closes back below the cloud
That combination is meant to keep the strategy in Bitcoin only during confirmed uptrends and to step aside when price loses the cloud. It is a long-only, trend-following approach with no leverage.
Test Setup
The backtest ran on CoinQuant with a single strategy on a single instrument, so the result reflects the Ichimoku logic alone.
The Backtest Results

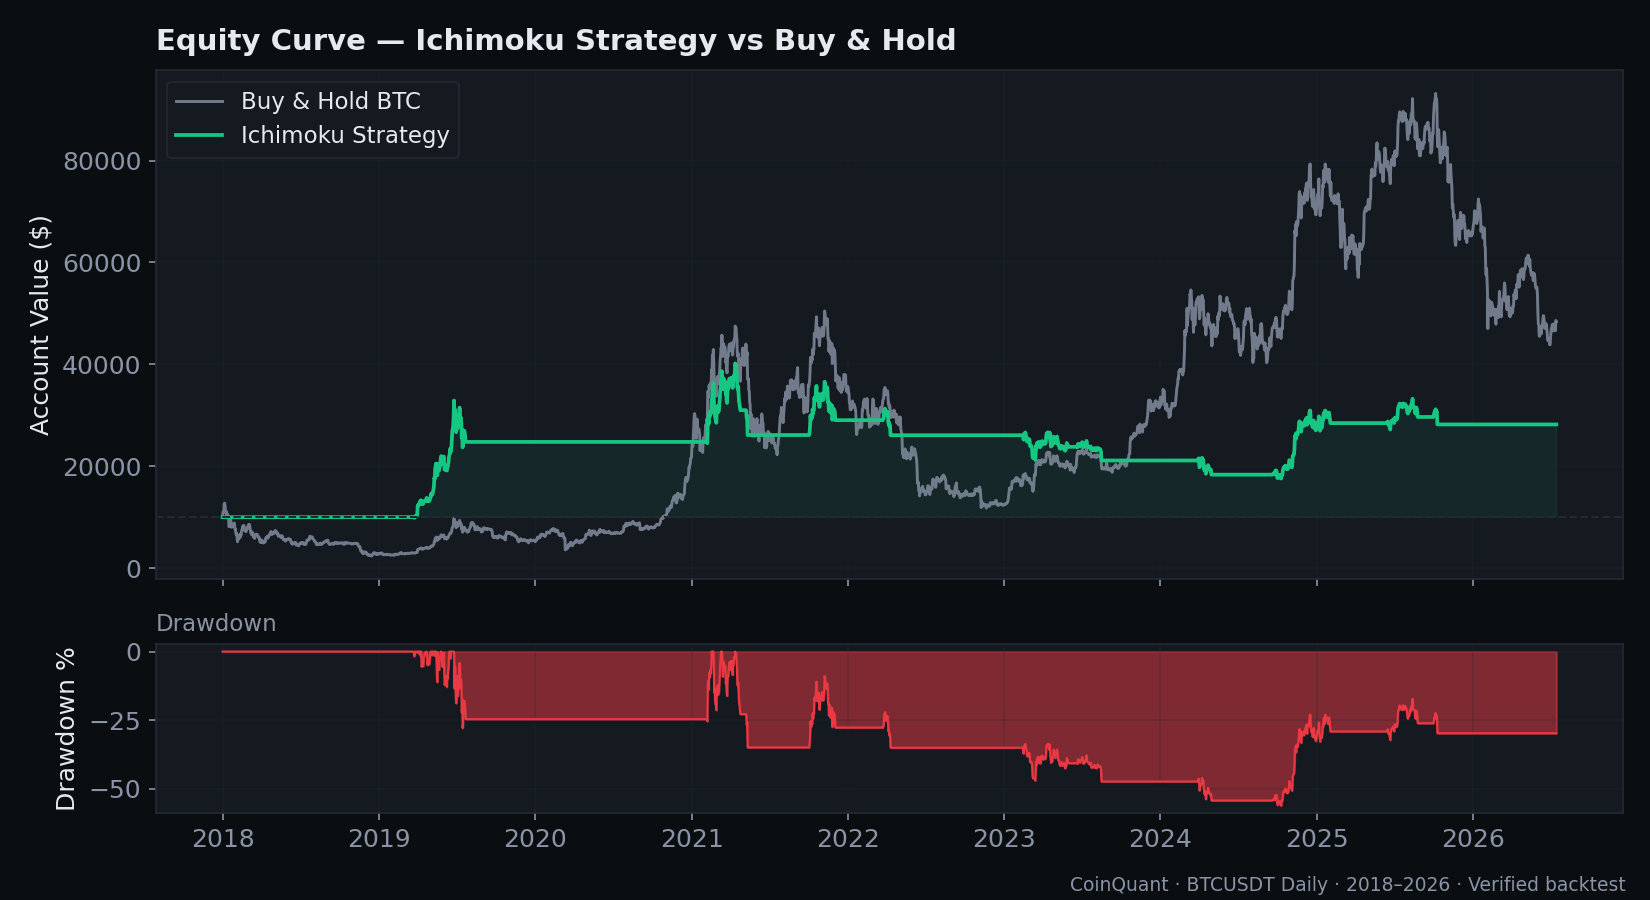
Over the full 2018 to 2026 period, the Ichimoku Cloud strategy turned $10,000 into $28,207. That is a +182.07% total return across just 12 trades, with the strategy holding a position only 22.16% of the time.
What the Data Shows

A real edge, but a rough ride
The headline number is the Profit Factor of 1.95. For every $1.00 the strategy lost, it produced $1.95 in gross profit. That is a genuine positive expectancy, not a coin flip.
The win rate is exactly 50%, so the edge does not come from being right more often. It comes from the size of the wins. The average win of $6,245 is nearly double the average loss of $3,211, giving a payoff ratio of 1.95. This is the classic trend-following profile: win big when a trend runs, lose small when it does not.
The best single trade earned +$14,775, which alone accounts for a large share of the total return. Trend-following strategies live and die by capturing the few large moves, and on Bitcoin the cloud kept the strategy in during the biggest sustained uptrends.
The drawdown is the real cost
The uncomfortable number is the 56.26% max drawdown. Even with a solid profit factor, an Ichimoku trader on Bitcoin had to sit through a period where more than half the account value was underwater at the peak-to-trough point.
The risk-adjusted ratios reflect this tension:
Sharpe 0.57 is positive but modest
Sortino 0.30 shows the downside volatility was significant
Calmar 0.23 confirms the return was small relative to the drawdown
The strategy made money, but it did not make it comfortably.
Only in the market one day in five
The most useful figure for context is time in market: 22.16%. The Ichimoku strategy was flat roughly four days out of five, only holding Bitcoin during confirmed above-cloud uptrends.
That selectivity is the point of the cloud. It is designed to keep a trader out of chop and sideways phases, which is exactly the environment Bitcoin has been in through mid-2026.
Ichimoku vs Simply Holding Bitcoin
A trend strategy is only interesting if it earns its complexity against the simplest benchmark: buying and holding.
Over the same window, buy-and-hold Bitcoin finished ahead of the Ichimoku strategy in absolute terms. The strategy captured roughly 65% of the buy-and-hold outcome while being exposed to the market only about 22% of the time.
This is the honest tradeoff. Buy-and-hold won on raw return, but it required full exposure through every crash. The Ichimoku strategy gave up some upside in exchange for spending most of the period in cash, which is a very different risk experience even when the ending balance is lower.
For a trader who cannot stomach holding through an 80% Bitcoin bear market, capturing 65% of the upside while in the market one fifth of the time is a legitimate design choice, not a failure.
The Practical Lesson
This backtest is not a claim that Ichimoku is the best Bitcoin strategy. It is a demonstration of what the cloud actually does over a full cycle:
It produces a real positive edge (Profit Factor 1.95) on daily Bitcoin
It wins through large trend captures, not a high win rate
It carries a severe drawdown that many traders would not tolerate
It underperforms buy-and-hold on raw return but with far less time exposed
The Quality Score of 45 out of 100 captures this balance. The strategy is profitable and has a genuine edge, but the deep drawdown and modest risk-adjusted ratios keep it out of the top tier.
The next logical step is not to accept these numbers as final. It is to test variations: adding a Kijun-based trailing exit, requiring a higher-timeframe trend filter, or reducing position size to cut the drawdown. Each of those changes needs its own backtest before it earns a place in a live strategy.
That is the entire purpose of backtesting an Ichimoku Cloud strategy on Bitcoin before you trade it: you see the drawdown on a spreadsheet instead of in your account.
Run this Ichimoku backtest yourself and test your own variations on CoinQuant. Run this Ichimoku backtest free on CoinQuant
Disclaimer:
This content is for educational and informational purposes only and does not constitute financial, investment, or trading advice. All strategies and examples are for illustrative purposes and do not guarantee results. Always conduct your own research before making financial decisions.
Key Takeaway