
Ichimoku Cloud Strategy Backtest on Ethereum: Testing Trend Signals Across Bull and Bear Phases

The Ichimoku Cloud is the most complete indicator package in technical analysis: trend direction, momentum, and support and resistance all in one view. Its most basic trend signal is also its most famous: price crossing above the cloud is bullish, price crossing below the cloud is bearish. Followers trust it because the cloud forces a trader to respect the trend instead of fighting it.
Trust is not a backtest. This article runs the cloud-cross trend strategy on Ethereum over five years, August 2021 to August 2026, a window that contains both a major bull phase and one of crypto's deepest bear markets. The question is whether cloud-based trend signals produced an edge through both regimes, and what the five-year result actually looks like after fees.
The Strategy
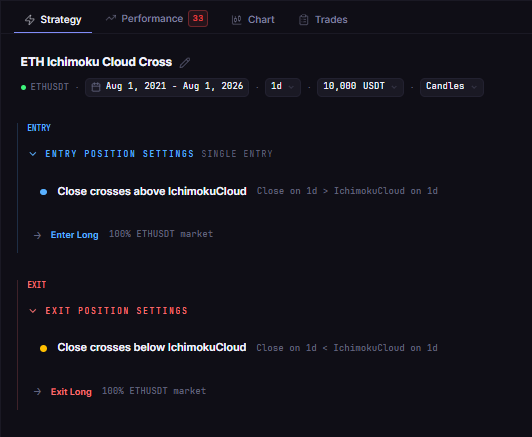
ETH Ichimoku Cloud Cross 1D 2021-2026
The strategy uses the standard Ichimoku construction: Tenkan-sen at 9 periods, Kijun-sen at 26, Senkou Span B at 52.
Entry: close crosses above the cloud top, the higher of Senkou Span A and Senkou Span B
Exit: close crosses below the cloud bottom, the lower of Senkou Span A and Senkou Span B
The logic is pure trend following: buy when price establishes itself above the cloud, sell when it falls back through it. Long only, one position at a time, 100% of equity per entry, 0.1% taker fee modeled, on ETHUSDT daily.
Test Setup
| Parameter | Value |
|---|---|
| Strategy | ETH Ichimoku Cloud Cross 1D 2021-2026 |
| Instrument | ETHUSDT (spot, Binance) |
| Timeframe | Daily (1D) |
| Tested window | 2021-08-01 to 2026-08-01 (5 years) |
| Ichimoku settings | 9 / 26 / 52 |
| Entry | Close crosses above cloud top (max of Senkou A, Senkou B) |
| Exit | Close crosses below cloud bottom (min of Senkou A, Senkou B) |
| Direction | Long only, no leverage |
| Initial capital | $10,000 |
| Position size | 100% of equity per entry |
| Fees | 0.1% taker, modeled |
| Data source | Kaiko via CoinQuant |
The Backtest Results
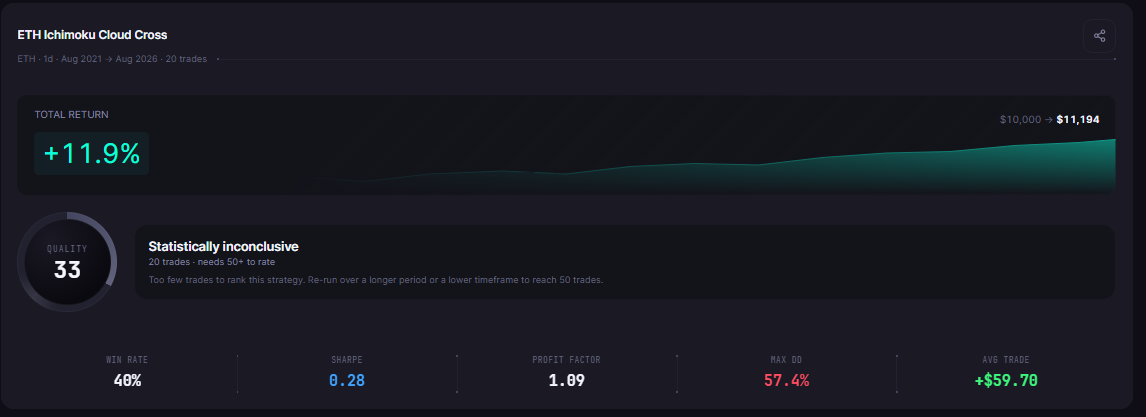
Five years of cloud-based trend signals on Ethereum produced a positive result, and a modest one: $10,000 became $11,194.06.
| Metric | ETH Ichimoku Cloud Cross |
|---|---|
| Total Return | +11.94% |
| Final Balance | $11,194.06 |
| Total Trades | 20 |
| Win Rate | 40.0% (8W / 12L) |
| Profit Factor | 1.09 |
| Sharpe Ratio | 0.28 |
| Sortino Ratio | 0.40 |
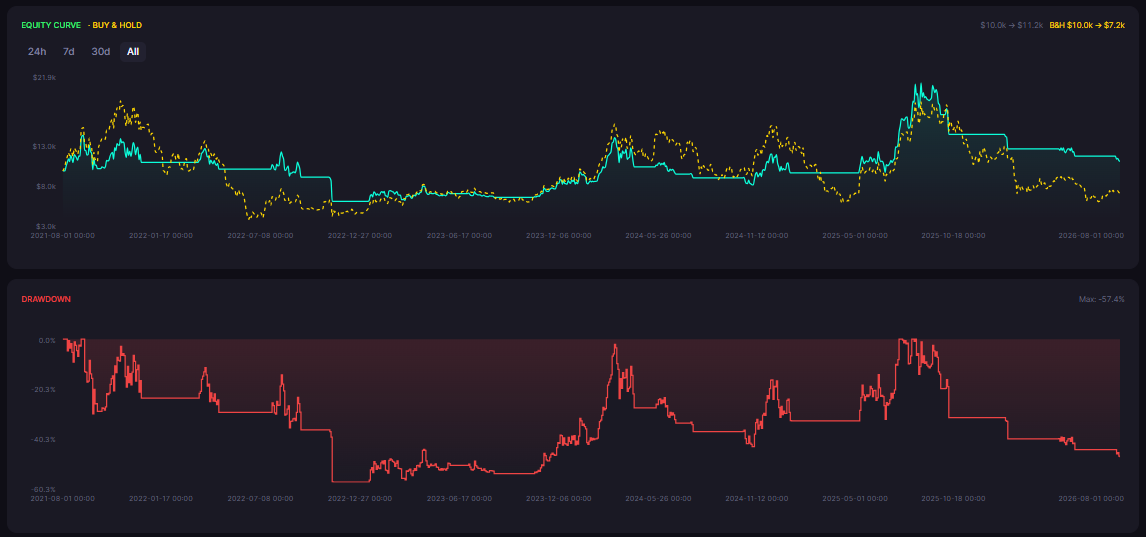
| Max Drawdown | 57.40% |
| Average Win | $1,840.54 |
| Average Loss | $1,127.52 |
| Best Trade | +$7,350.00 |
| Worst Trade | -$3,039.01 |
| Time in Market | 47.29% |
| Total Fees | $79.36 |
What the Five Years Looked Like
The trade log tells a coherent story about how the strategy behaved through the two regimes. In the late-2021 bull phase, cloud-cross entries caught the trend: the strategy closed winning trades in September and December 2021 with ETH between $2,804 and $3,782. Those two winners, plus the strategy's best trade of +$7,350.00 elsewhere in the window, are the bull-phase payoff of trend following.
The 2022 bear market is where the strategy's character shows. As ETH fell from the $2,800 area in April 2022 to roughly $1,100 by November 2022, the strategy took three consecutive losses, including its worst trade of -$3,039.01, closed on 2022-11-09 with ETH near $1,100. A cloud-cross strategy is long-biased: it buys every reclaim of the cloud, and in a bear market each reclaim failed. That sequence produced the 57.40% max drawdown.
The recovery phase followed the same logic in reverse. Entries in early 2023, with ETH between $1,437 and $1,873, closed higher in March and May 2023. The strategy does not predict regimes, it obeys them, which is exactly why its five-year result is the sum of obeying both the bull and the bear.
Why +11.94% Over Five Years Is a Realistic Verdict
Five years of Ethereum history, including a cycle top and a deep bear, produced a total return of 11.94%, roughly 2.3% a year before considering that capital sat in the market less than half the time. That is the honest outcome of an unfiltered cloud-cross system on this asset in this window.
The structure explains why. With a 40% win rate and a profit factor of 1.09, the strategy's winners barely outweighed its losers. Trend following only works when the winning trends are large enough to pay for the losing false signals, and across this window Ethereum's recoveries were real but the strategy's exits gave back a meaningful share of them. The one trade that made the strategy's case, +$7,350.00, also shows the ceiling: when a sustained trend did develop, the cloud-cross held it and collected the full move.
The Practical Lesson
The cloud-cross trend strategy on daily ETH returned +11.94% over five years, with a 40% win rate and a 57.40% max drawdown
The strategy obeyed both regimes: winners in the 2021 bull and the 2023 recovery, and a sequence of losses through the 2022 bear including its worst trade of -$3,039.01
A profit factor of 1.09 over 20 trades is fragile evidence, and the 57.40% drawdown is the number that would end most accounts
Trend signals across bull and bear phases worked on Ethereum in this window, and the margin was thin enough that filters or exits need their own tests before live capital
The Ichimoku cloud question is answered for this window: on daily Ethereum from August 2021 to August 2026, cloud-cross signals captured the trends that existed and paid for them during the trends that failed, netting +11.94% with a drawdown most traders could not hold. The natural next steps are a cloud filter that avoids longs while price is below the cloud, a Kijun-sen exit instead of the cloud bottom, or testing the same logic on a faster timeframe. Each variation needs its own verified backtest before it earns a place in a live strategy.
Run the Ichimoku cloud strategy on Ethereum and test your own variations. Backtest Ichimoku free on CoinQuant
Disclaimer:
Key Takeaway
