
How to Use Backtesting to Compare Crypto Assets and Allocate Smarter (2026 Guide)

Most traders build a strategy for one asset and stick with it. The assumption is that if the strategy works on BTC, it works everywhere. That assumption is wrong, and backtesting is how you find out.
The same strategy applied to BTC, ETH, and SOL will produce materially different results. Different volatility profiles, liquidity characteristics, and market behavior produce different outcomes for identical rules. The only way to know which asset best suits your strategy is to test it on each one and compare.
This is the crypto portfolio backtesting guide for traders who want to make allocation decisions based on evidence rather than assumption.
Why the Same Strategy Behaves Differently on Different Crypto Assets
The three most traded crypto assets in mid-2026 sit at very different price levels and volatility profiles. BTC at $63,000 moves slowly relative to its price. SOL at $73 can swing 10% in a day. ETH at $1,857 sits between them in both price and volatility.
This matters for strategy performance in ways that are not always intuitive:
A mean-reversion strategy may produce much stronger results on a more volatile asset like SOL, because the reversion moves are larger.
A trend-following strategy may perform better on BTC, where sustained directional moves are more common.
A tight stop-loss that works on BTC may be triggered repeatedly by normal noise on SOL.
The same strategy, the same indicators, the same parameters: different asset, different outcome. That is not a flaw. That is information. And backtesting is how you extract it systematically.
The Confirmed Workflow: Clone, Re-Run, Compare
CoinQuant supports a sequential multi-asset comparison workflow. Here is how it works:
Build and backtest your strategy on the first asset. Run the full backtest. Record the results: total return, Sharpe ratio, max drawdown, win rate, profit factor.
Clone the strategy. In CoinQuant, you can clone an existing strategy to create an identical copy with all settings preserved.
Re-run the cloned strategy on a second asset. Change only the asset. Everything else stays the same: the indicators, parameters, timeframe, date range, and backtest settings.
Compare the results side by side. You now have two backtest result sets for identical strategy logic on different assets. The difference in performance is driven by the asset itself, not by strategy variation.
This workflow isolates the asset variable cleanly. You are not comparing apples to oranges. You are comparing the same apple on two different soils.

Step 1: Build and Backtest Your Strategy on the First Asset
Start with the asset you know best. If you have been watching BTC most closely, use BTC as your baseline.
Define a complete strategy:
Entry condition: For example, enter long when RSI drops below 35 and closes back above it on the 4-hour chart.
Exit condition: Exit at +4% profit or -2% loss.
Timeframe: 4-hour chart.
Backtest period: A multi-year range that covers different market regimes. At minimum, include a bull period, a bear period, and a range period.
CoinQuant uses Kaiko data for crypto assets, which goes back to 2017 for BTC. This gives you enough history to test across multiple market cycles rather than just recent conditions.
Run the backtest and record your baseline results. These numbers become the reference point for every subsequent comparison.
Step 2: Clone the Strategy and Re-Run It on a Second Asset
Once you have the baseline results on your first asset, clone the strategy in CoinQuant. The clone preserves all conditions and parameters.
In the cloned version, change only the asset. If you tested on BTC first, switch to ETH. Keep the same indicator settings, the same entry and exit logic, the same date range.
Run the backtest on the second asset.
Now do the same for a third asset if relevant. SOL, XRP, and ETH are all supported on CoinQuant. Each runs through the identical strategy logic, producing a separate result set.
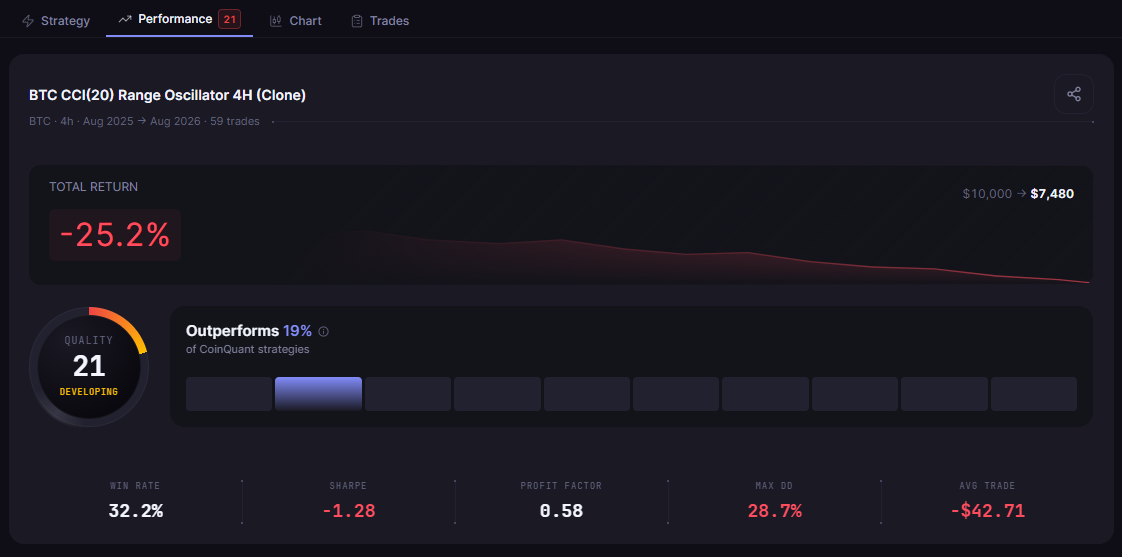
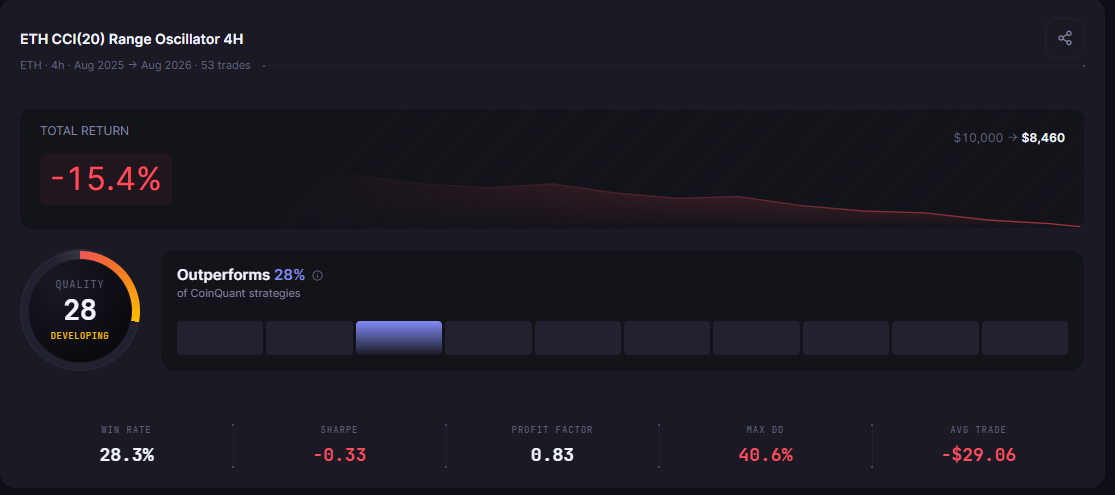
Backtest results for the cloned strategy after changing only the asset. All indicators, parameters, timeframe, and date range remain identical, allowing performance differences to be attributed to the asset rather than changes to the strategy.
What you are looking for is not necessarily which asset produced the highest return. You are looking at which asset best matched your strategy's intended behavior: its expected win rate, risk profile, and drawdown tolerance.
Step 3: Compare the Results Side by Side
With two or three backtest result sets in hand, you can now do a structured comparison. Use a table to make this readable.
| Metric | BTC (Baseline) | ETH (Clone) | SOL (Clone) |
|---|---|---|---|
| Total return | From backtest | From backtest | From backtest |
| Win rate | From backtest | From backtest | From backtest |
| Max drawdown | From backtest | From backtest | From backtest |
| Sharpe ratio | From backtest | From backtest | From backtest |
| Profit factor | From backtest | From backtest | From backtest |
| Total trades | From backtest | From backtest | From backtest |
Look at each metric in the context of your strategy's design intent:
If you designed a trend-following strategy, compare the Sharpe ratio first.
If you designed a mean-reversion strategy, look at win rate and profit factor.
If you have strict drawdown limits, prioritize max drawdown across assets.
The goal is to identify which asset your strategy logic fits best, not which asset happened to perform best in the test period.
What the Comparison Tells You About Allocation Decisions
The multi-asset backtest comparison does not tell you to put all your capital into one asset. What it does tell you is which asset best suits a specific strategy.
A trader running three different strategy types, one momentum, one mean-reversion, one trend-following, might find that:
The momentum strategy performs best on SOL because the intraday moves are larger.
The mean-reversion strategy performs best on ETH because it oscillates more predictably.
The trend-following strategy performs best on BTC because sustained trends are more reliable there.
If those results hold up across multiple backtest periods, you have an evidence-based reason to allocate each strategy to its best-suited asset. That is a materially different approach from guessing which asset to trade, or from running the same strategy on everything and hoping.
This is what systematic portfolio allocation looks like in practice. You are not predicting the future. You are identifying which historical patterns your strategy captures most consistently across different assets.
Common Mistakes When Comparing Assets With Backtesting
Changing multiple variables between runs. If you change the asset AND the timeframe AND the parameters between runs, the comparison result is meaningless. You cannot isolate the asset effect if you have changed other things. The clone workflow exists specifically to prevent this.
Testing only on a bull market period. BTC, ETH, and SOL all perform differently depending on the market regime. A comparison that only covers 2020-2021 is not a reliable basis for allocation decisions. Test across periods that include 2022 conditions, sideways 2024 conditions, and more recent data.
Assuming the best backtest result predicts the best live result. Backtest results reflect historical behavior under historical conditions. The asset with the highest backtest return is not guaranteed to produce the highest live return. Use the comparison to identify robustness and fit, not just peak performance.
Skipping the full comparison table. It is tempting to look at one or two numbers and draw a conclusion. Read all five key metrics for each asset before making any judgment.
Disclaimer:
Key Takeaway
