
How to Build a Crypto Day Trading Strategy Without Writing Code (2026 Step-by-Step)

Building a crypto day trading strategy used to mean writing scripts, configuring API connections, or learning Pine Script. Most traders who wanted to day trade systematically either accepted the technical barrier or gave up and kept trading manually.
That barrier no longer exists. In 2026, you can define a complete day trading strategy in plain English, backtest it against years of real crypto price data, and have results in minutes.
This guide walks through how to build a crypto day trading strategy without writing code, from picking your setup to testing it before you commit real capital.
What Makes Day Trading Different From Swing or Position Trading
Day trading means you open and close positions within a single trading session. You are not holding overnight. You are not waiting for a multi-week trend to play out. Your edge, if you have one, comes from identifying short-term conditions that repeat reliably enough to trade systematically.
This has implications for how you build your strategy:
Shorter timeframes (15-minute, 1-hour, 4-hour charts are typical for day trading)
Tighter entry and exit conditions
Higher trade frequency, which means fees matter more than in swing trading
Greater sensitivity to volatility and liquidity
A well-built day trading strategy is precise. Vague setups that might work over weeks do not have time to play out in a single session. Clarity and specificity are not optional here.
Step 1: Choose Your Asset and Timeframe
Start with one asset. Crypto day trading strategies behave very differently across assets. BTC at $63,000 trades differently than SOL at $73. The volatility profile, liquidity, and typical intraday range are all different.
Pick the asset you already watch most closely. If you have been manually day trading ETH for several months, start there. You already have intuitions about how it moves that are worth testing.
Then choose a timeframe. For day trading, the 1-hour chart is a practical starting point. It gives you enough signal resolution to catch intraday moves without being overwhelmed by noise. The 4-hour chart works if you want fewer, higher-conviction entries per day.
CoinQuant supports multi-timeframe strategies if you eventually want to add a higher-timeframe filter, but start with a single timeframe for your first backtest.
Step 2: Define Your Entry Condition
Your entry condition is the specific market event that tells the strategy to open a position. It needs to be exact. "When the market looks strong" is not an entry condition. "When the RSI on the 1-hour chart crosses above 50 and the price is above the 50-period EMA" is.
A few examples of specific entry conditions for crypto day trading:
RSI crosses above 50 after being below 40 on the 1-hour chart
Price closes above the VWAP and RSI is between 50 and 70
Stochastic crosses above 20 on the 4-hour chart while price is above a 20-period moving average
EMA(9) crosses above EMA(21) on the 1-hour chart
Notice that each of these is measurable. You can look at a historical chart and say precisely whether the condition was met at any given candle. That is what the strategy builder requires, and it is what makes the backtest meaningful.
Step 3: Set Your Exit Condition
Your exit condition is as important as your entry. Many traders spend weeks refining their entries and then exit based on gut feel. A systematic strategy needs a defined exit.
You have three main options:
Fixed target and stop loss. Set a percentage take-profit and stop-loss at entry. For example, exit at +3% gain or -1.5% loss. This is the simplest approach and easy to backtest cleanly.
Indicator-based exit. Exit when the entry signal reverses. If you entered when RSI crossed above 50, exit when it crosses back below 50. This keeps you in trends longer but can give back gains in choppy markets.
Time-based exit. Close the position at the end of the session regardless of profit or loss. This is a strict day trading approach that ensures you never hold overnight.
For a first strategy, a fixed target and stop loss is the clearest starting point. It makes the risk per trade explicit, which is essential for evaluating whether the strategy's win rate and risk/reward ratio actually justify trading it.
Step 4: Write the Strategy in Plain English
Before you build it on the platform, write your strategy out as a sentence. This step catches logical gaps before you spend time configuring and backtesting.
Here is an example:
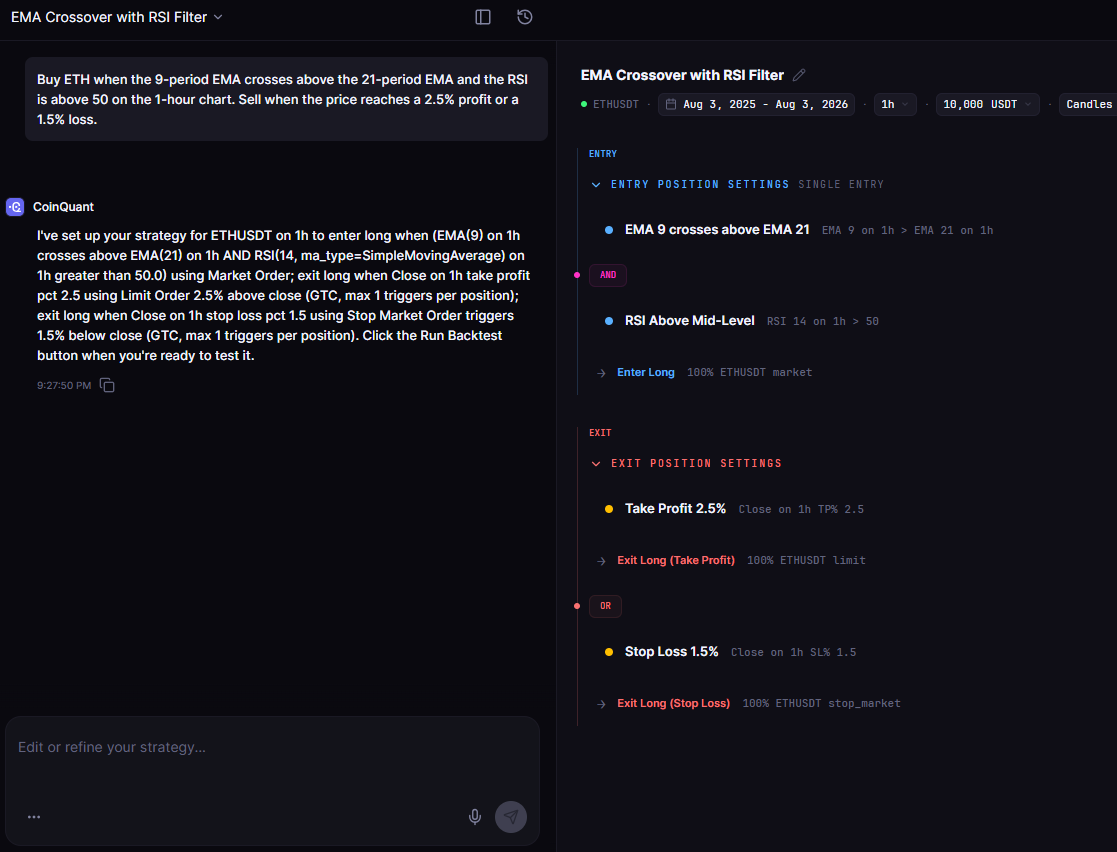
"On ETH, 1-hour chart: enter long when the 9-period EMA crosses above the 21-period EMA and RSI is above 50. Exit at +2.5% profit or -1.5% loss. Run on 2022 to 2025 data using Kaiko."
If you cannot write it in one or two sentences, the strategy is probably not specific enough yet. Go back to Steps 2 and 3 and tighten the conditions.
Once you have the plain-English version, entering it into CoinQuant is straightforward. The platform prompts you for each component: asset, timeframe, entry condition, exit condition, and backtesting date range.
Step 5: Backtest Before You Go Live
This is where day trading strategies get tested against reality. A backtest runs your strategy rules against historical price data and shows you how it would have performed.
CoinQuant uses Kaiko data for crypto, which goes back to 2017 for BTC and covers major assets including ETH, SOL, and XRP. The backtest accounts for trading fees and slippage, so results are not based on idealized conditions.
After running the backtest, review these metrics:
| Metric | What It Tells You |
|---|---|
| Total return | Raw performance over the test period |
| Win rate | Percentage of trades that closed in profit |
| Max drawdown | The worst peak-to-trough loss during the period |
| Sharpe ratio | Return relative to risk taken |
| Profit factor | Gross profit divided by gross loss |
A strategy with a decent win rate but a terrible Sharpe ratio is not necessarily a good strategy. It might be generating a lot of small wins and occasional large losses that destroy the overall return. Look at all five metrics together.
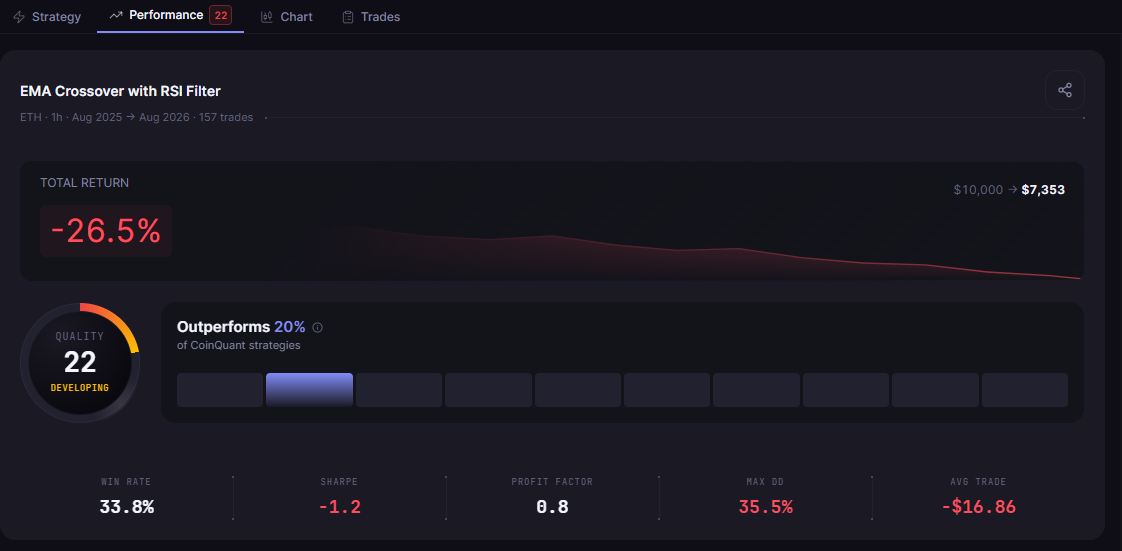
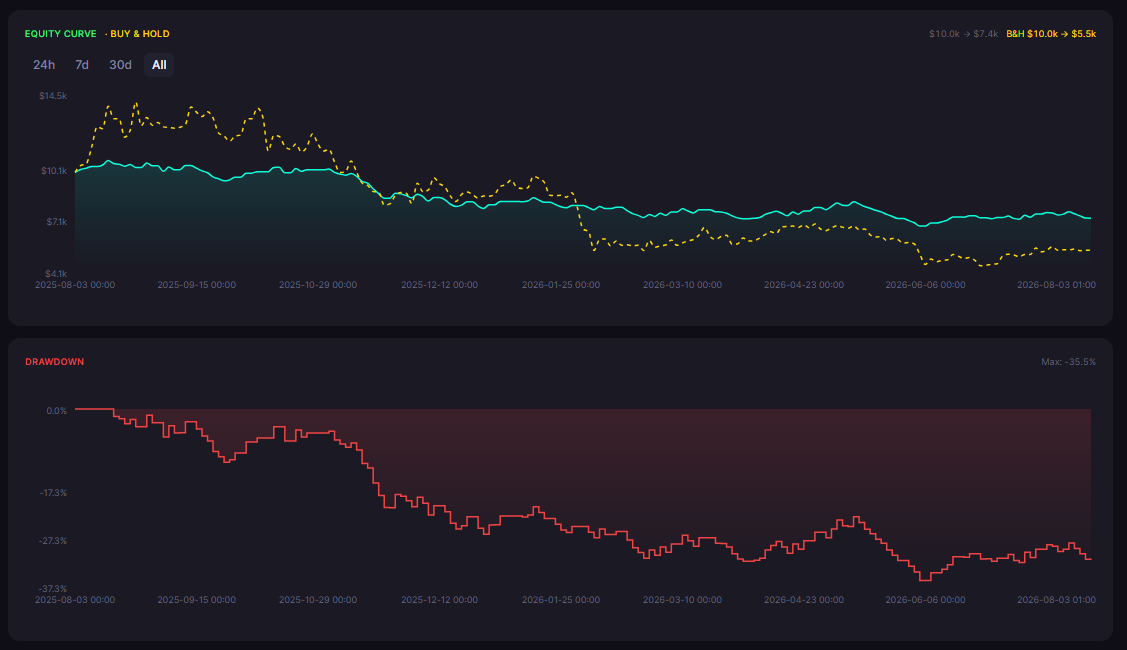
If the first backtest is disappointing, that is useful information. Adjust one variable at a time. Change the exit threshold, try a different timeframe, or add a trend filter. Each iteration teaches you something about how the strategy actually behaves.
Common Day Trading Strategy Mistakes to Avoid
Over-optimizing for historical data. If you keep adjusting parameters until the backtest looks perfect, you have likely created a strategy that fits the past but will not perform in the future. Test across multiple periods, including different market regimes.
Ignoring fees in your calculation. Day trading generates more trades than swing trading. Fees accumulate. Always backtest with realistic fee assumptions. CoinQuant includes fees and slippage in backtest results by default.
Setting stops too tight for the timeframe. A 0.5% stop on a highly volatile asset on a 1-hour chart will be triggered by normal price noise, not by actual strategy failure. Calibrate your stop to the typical volatility of the asset and timeframe.
Testing only on bull market data. If you test a long-only strategy only against 2020-2021 data, you will see impressive results. Test the same strategy against 2022 or early 2024 and see whether it holds up.
Skipping the "what not to do" conditions. Sometimes the most valuable thing a backtest reveals is not what works but what specific conditions produce consistently poor results. Building those as exclusion filters can improve a strategy significantly.
Disclaimer:
Key Takeaway
