How to Backtest Any Crypto Strategy Without Writing Code
How to Backtest Any Crypto Strategy Without Writing Code
Most crypto traders have a strategy. They have seen an indicator work on a chart, heard about a system from someone on Twitter, or developed their own rules for entering and exiting trades. The question they almost never answer before risking real money is: has this actually worked historically?
Backtesting is how you answer that question. And until recently, doing it properly required either expensive institutional software or knowing how to code.
This guide shows you how to backtest any crypto, stock, or forex strategy without writing a single line of code. No Python, no Pine Script. Just your strategy, tested against real historical data.
What Is Backtesting and Why Does It Matter?
Backtesting is the process of running a trading strategy against historical price data to see how it would have performed in the past. You define your rules: when to buy, when to sell, which indicator triggers the entry. The system then tests those rules against real price history, trade by trade.
The output tells you:
Total return: how much the strategy made or lost over the test period
Win rate: what percentage of trades were profitable
Max drawdown: the largest peak-to-trough loss during the period
Sharpe ratio: how much return you earned per unit of risk
Profit factor: gross profit divided by gross loss
Expectancy: average profit or loss per trade
Why does this matter before you trade live? Because human memory is selective. We remember the setups that worked. We forget the ones that did not. A backtest removes that bias and shows you the unfiltered truth about your strategy: how it performs across bull markets, bear markets, and the choppy sideways grind in between.
A strategy with a 30% win rate might still be profitable if winners are 4x larger than losers. A strategy with a 70% win rate might still destroy your portfolio if the rare losses are catastrophic. You cannot know which category your strategy falls into without testing it.
The Old Way vs. The New Way
The old way
To backtest properly, you traditionally needed one of these:
TradingView + Pine Script: TradingView's built-in backtesting requires writing code in Pine Script, their proprietary programming language. Learning curve: weeks to months for non-programmers.
QuantConnect or Backtrader: Python-based platforms built for quantitative developers. Extremely powerful, entirely inaccessible to anyone without programming experience.
Excel: Some traders manually track every historical signal in a spreadsheet. This works for simple strategies but breaks completely for anything with multiple conditions or large data sets.
The result: most retail traders never backtest properly. They either skip it entirely and trade on intuition, or they use the weak strategy tester built into their exchange app, which typically only covers the last 30 days of data and does not simulate fees, slippage, or realistic execution.
The new way
Natural language strategy builders let you describe your strategy in plain English. The platform generates the logic, runs the backtest, and scores the results automatically.
CoinQuant goes beyond simple single-indicator strategies. You can describe complex strategies including multi-timeframe logic (for example: use a daily trend filter while entering on a 4-hour signal), multi-asset portfolios tested simultaneously, multi-position strategies, multi-indicator conditions, and indicator-within-indicator logic. All in plain English, no code required.
Step-by-Step: How to Backtest on CoinQuant
Step 1: Define Your Strategy in Plain English
Before you open the platform, write out your strategy rules the way you would explain them to another trader. Be specific.
Basic example (single timeframe): "Long-only BTCUSDT on the 4-hour chart. Enter long when RSI(14) crosses below 30 and then crosses back above 30. Exit when RSI crosses above 70."
Advanced example (multi-timeframe): "Long-only BTCUSDT. Only enter if the daily 50-period EMA is above the daily 200-period EMA. On the 4-hour chart, enter when RSI(14) crosses above 30 from below. Exit when 4-hour RSI crosses above 70 or when the daily trend filter breaks."
The more specific your rules, the more accurate your backtest will be. If your strategy is vague, the results will be vague.
.png)
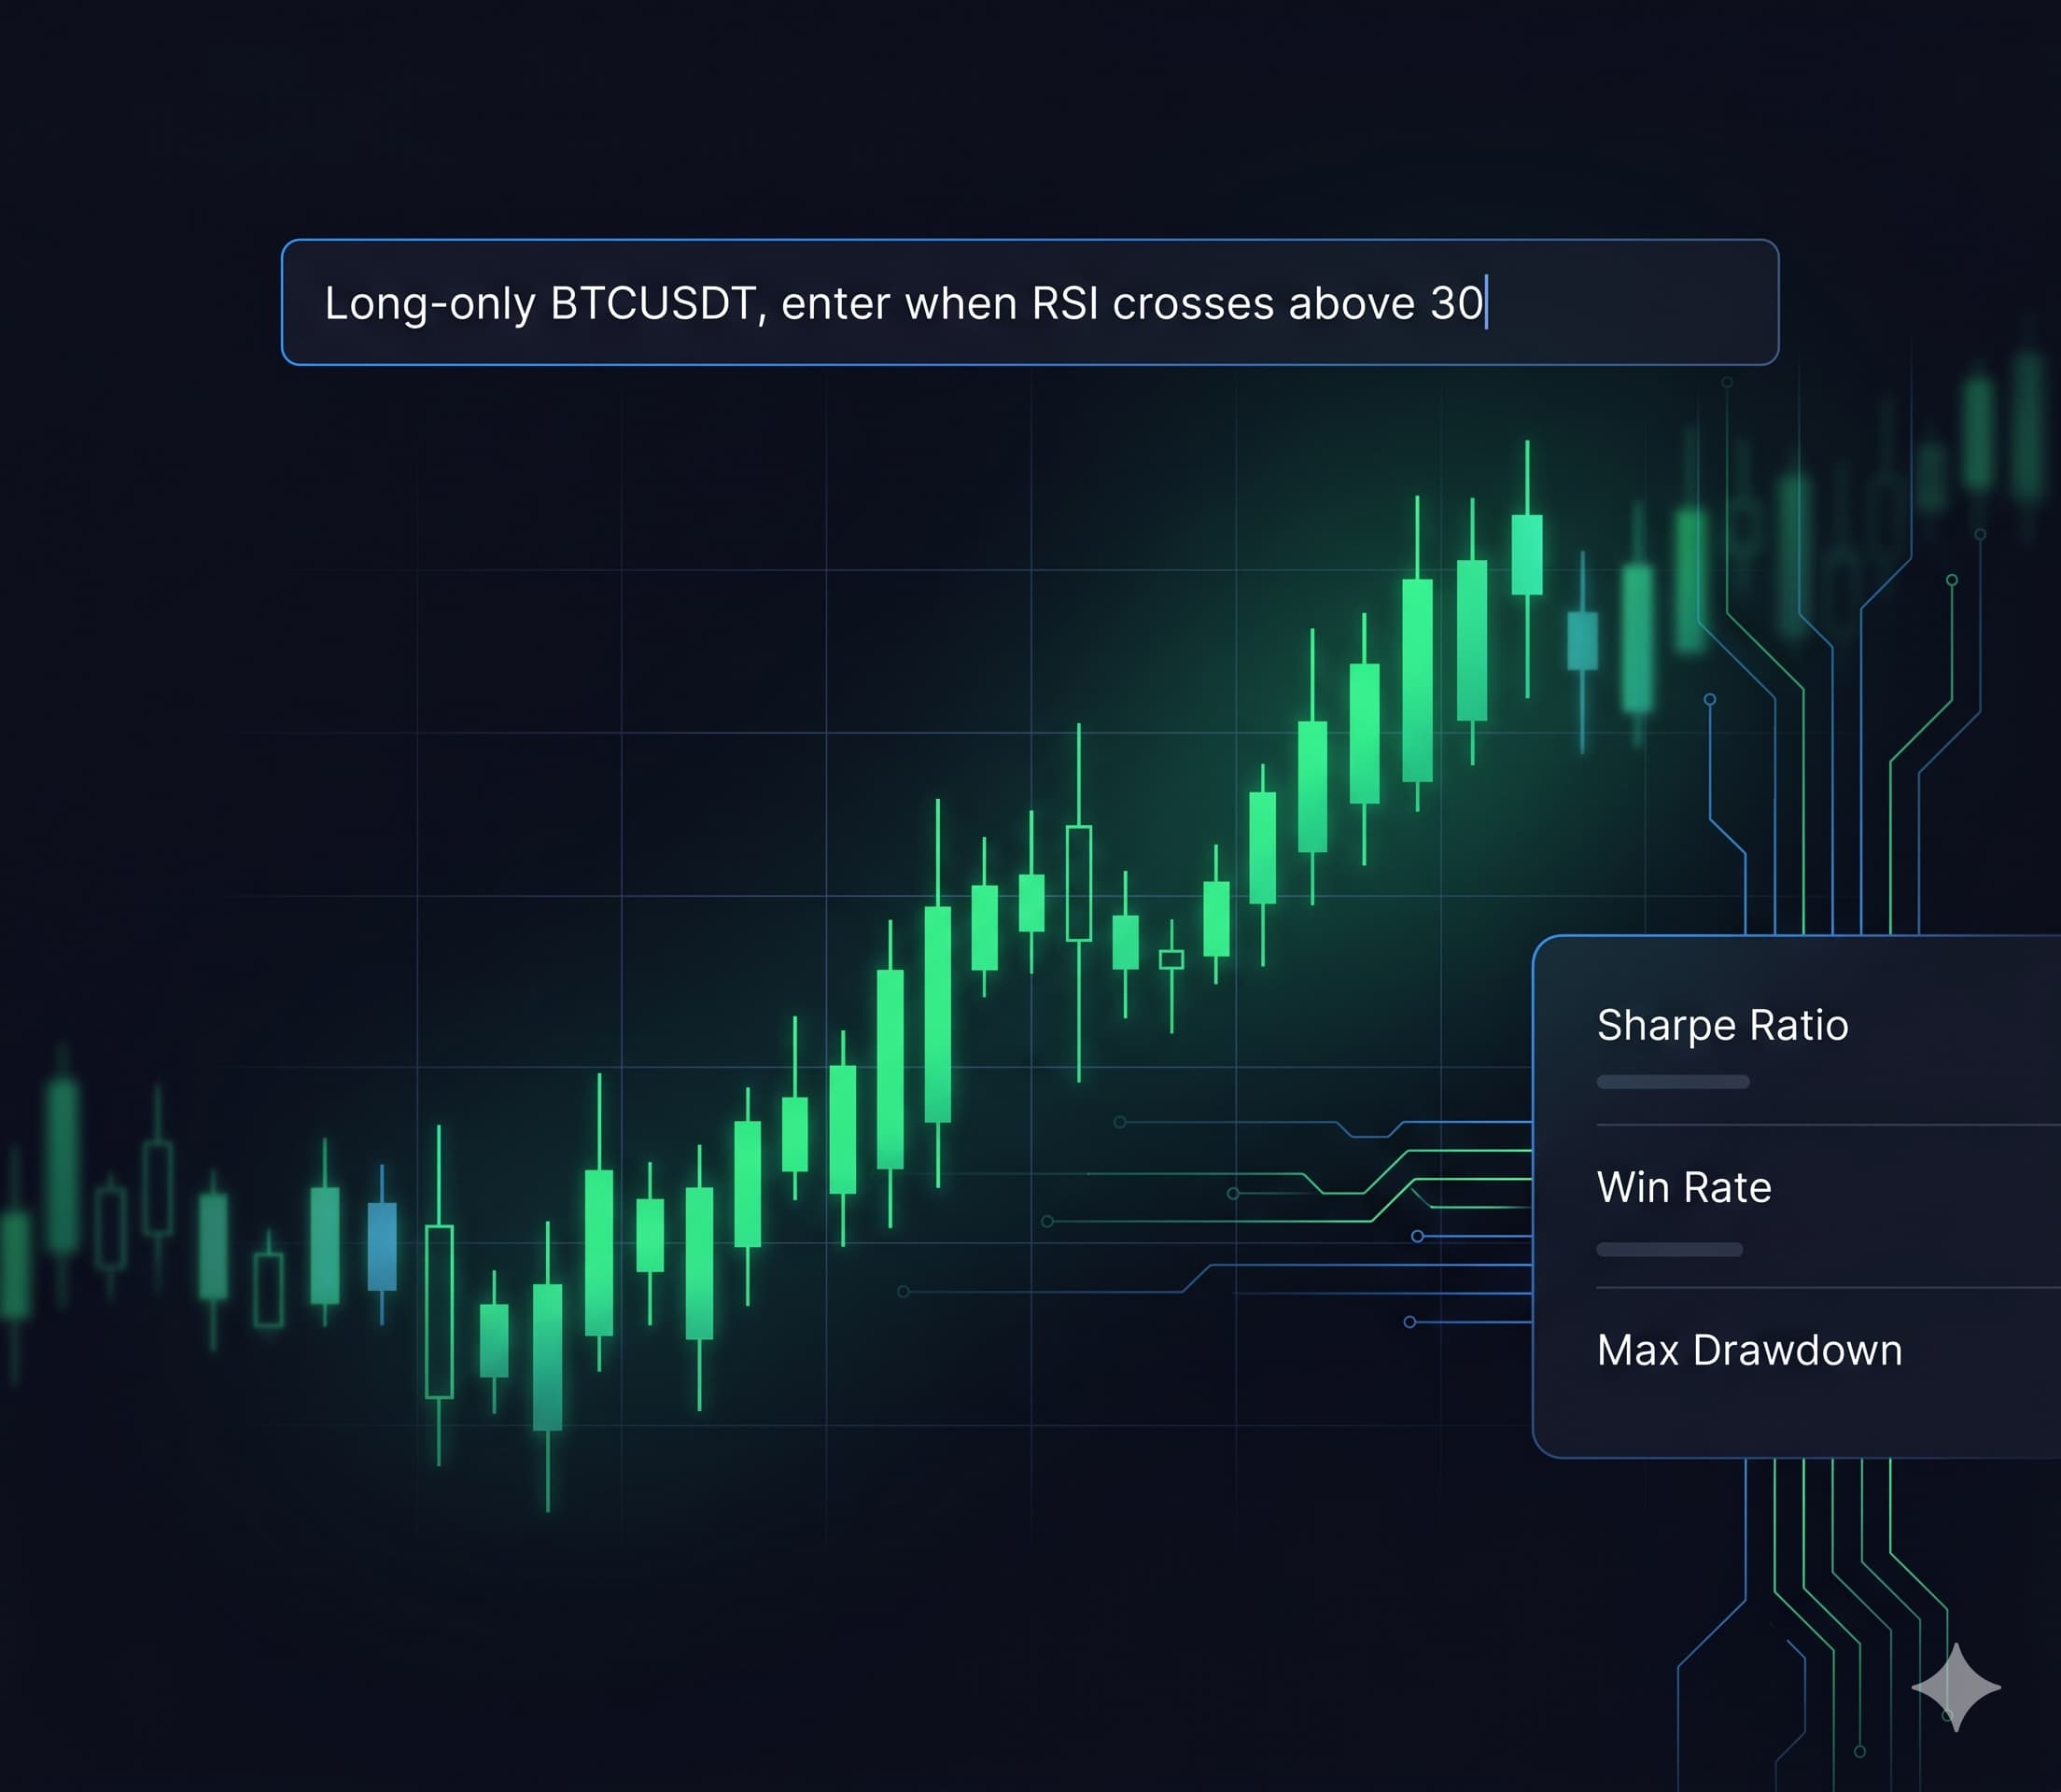
Step 2: Enter It into CoinQuant
Open CoinQuant and go to the strategy builder. Type your strategy description into the natural language input field exactly as you wrote it.
CoinQuant's AI reads your description and automatically generates the full strategy schema: which indicator, which timeframe, which entry condition, which exit condition. No code required.
.png)
You can review the generated schema and adjust any parameter before running. Common things to check:
Is the timeframe correct? (1H, 4H, Daily, Weekly)
Is the asset correct? CoinQuant supports crypto via Kaiko (Binance, Coinbase, Kraken, and others) plus stocks, forex, and commodities via FMP
Is the date range correct? Longer is better. Minimum 6 months, ideally 2 or more years.
Are the entry and exit conditions exactly as you intended?
For multi-timeframe strategies: does the schema show both the higher and lower timeframe conditions correctly?
Step 3: Run the Backtest
Hit run. CoinQuant processes the strategy against real historical tick-level data from major exchanges via Kaiko. This typically takes 30 to 120 seconds depending on the date range and complexity.
Step 4: Read the Results
When the backtest completes, you will see the results dashboard. Here are the numbers that matter most:
Quality Score (0 to 100): CoinQuant's composite score combining return, risk-adjustment, consistency, and trade frequency. A score above 70 is strong. Below 50 means the strategy needs significant refinement.
Total Return: The raw percentage gain or loss over the test period. Context matters. Compare it to simply holding the asset over the same period.
Sharpe Ratio: The most important single number for most traders. Above 1.0 is good. Above 1.5 is excellent. Below 0.5 means too much risk for the return generated.
Max Drawdown: The worst period of loss during the test. If your strategy has a -45% max drawdown, ask yourself honestly: would you have kept trading through a 45% portfolio decline?
Win Rate vs. Profit Factor: Win rate alone is meaningless. A 40% win rate with a Profit Factor of 3.0 beats a 65% win rate with a Profit Factor of 1.1. Look at both together.
Expectancy: The average profit or loss per trade in percentage terms. Positive expectancy means the strategy makes money on average across all trades.
.png)
Step 5: Iterate and Validate Properly
A backtest is not a pass/fail test. It is a research process. Your first result will almost never be your final strategy.
Simple iteration framework:
Low Quality Score (below 50): The core signal is weak. Try a different indicator, a different timeframe, or add a trend filter.
High return but high drawdown (above 30%): The strategy is too aggressive. Add a stop loss, tighten position rules, or add a volatility filter.
Low win rate (below 40%) but positive return: The strategy catches large moves but loses on small ones. Consider widening exit conditions to let winners run.
High win rate (above 60%) but low overall return: The strategy exits too early. Consider a trailing stop or momentum-based exit.
For more rigorous validation, use CoinQuant's built-in robustness tools:
Strategy optimization: systematically test parameter combinations to find the strongest settings
Walk-forward testing: validate that your strategy works across different time windows, not just the period you tuned it on.
Monte Carlo simulations: stress-test your results across thousands of randomized market scenarios to see if the edge holds under different conditions
These three tools are what professional quant funds use to validate strategies before committing capital. On CoinQuant, they require no code.
What Backtesting Cannot Tell You
Backtesting is powerful, but it has limits you need to understand before trusting your results.
Past performance is not future performance. Markets change. A strategy that worked in the 2020 to 2021 bull market may not work in a different macro environment. Always test across multiple market conditions and include at least one major drawdown period in your test window.
Overfitting is a real risk. If you iterate too many times on the same data set, your strategy starts to fit historical noise rather than genuine patterns. A strategy with 200 custom rules that produces a perfect backtest is almost certainly overfit and will fail in live trading. Keep your rules simple and use walk-forward testing to validate on out-of-sample data.
CoinQuant simulates real fees, slippage, and spread in every backtest. Results reflect what you would actually earn after execution costs, not idealized fills. This is a significant advantage over platforms that show pre-cost results.
Survivorship bias: if you only test strategies that feel right because you have seen them work on recent charts, you are already biased toward setups that happened to work in the recent past. Good backtesting uses the full available history, not cherry-picked windows.
A Simple First Backtest to Try
If you have never backtested before, here is a clean starting point. Type this into CoinQuant:
Run a Golden Cross / Death Cross strategy on BTC/USDT daily candles from Jan 1 2019 to Mar 31 2026. Real results from CoinQuant no-code backtest (starting $10,000): Total Return: +633% ($10,000 to $73,337) CAGR: 31.6% annualized Sharpe Ratio: 0.80 (at the acceptability threshold) Win Rate: 62.5% (5 wins, 3 losses) Max Drawdown: 66.7% (brutal peak-to-trough decline) Profit Factor: 3.63 (winners far outpaced losers) Total Trades: 8 (only 8 signals in 7+ years) The Golden Cross returned 6x your capital. It also drew down nearly 67% at one point — four out of five traders would not survive that. Over 7 years, you waited for only 8 signals. The power of no-code backtesting is that you learn both numbers in minutes and decide whether you have the conviction to trade it.
This is the classic Golden Cross / Death Cross strategy. Running it on 7 years of Bitcoin data will show you immediately why the results may surprise you.
From there, try adding one condition and see what changes. Add: 'only enter if RSI(14) is above 50 at the time of the crossover.' Re-run. Compare the results. That is the backtesting process: systematic, iterative, data-driven.
Start Testing
The difference between traders who consistently make money and those who do not is usually not talent or access to special information. It is process. Backtesting is the foundation of a disciplined process: knowing why you are entering a trade, knowing what the historical edge looks like, and knowing when the edge has broken down.
Start your first backtest on CoinQuant - no code, free account.
Disclaimer:
This content is for educational and informational purposes only and does not constitute financial, investment, or trading advice. All strategies and examples are for illustrative purposes and do not guarantee results. Always conduct your own research before making financial decisions.
Key Takeaway