
How to Backtest a Range Trading Strategy (Step-by-Step, No Code)

Range trading strategies have a different logic from trend-following strategies. Where a trend system bets that a move will continue, a range system bets that price will reverse. When crypto markets are consolidating, as Bitcoin has been through much of 2025 and into 2026, that reversal bet is exactly what many traders want to test.
This guide shows how to backtest a range trading strategy on CoinQuant without writing a line of code. You will go from choosing the right indicators to reading the results table, all in plain English.
What Makes a Range Trading Strategy Different
A range trading strategy assumes that price will oscillate between a floor (support) and a ceiling (resistance). The strategy buys near the floor, sells near the ceiling, and repeats.
This is the opposite of how trend-following works. A trend strategy would wait for price to break out of that ceiling before entering. A range strategy would exit at the ceiling, expecting price to pull back.
Getting the distinction right matters for backtesting because the settings that define a good range strategy are different from the settings that define a good trend strategy.
The three most common tools for range trading are:
Stochastic Oscillator: measures whether price is near the top or bottom of its recent range
RSI (Relative Strength Index): similar logic, reading overbought and oversold conditions
Bollinger Bands: uses standard deviation to define the expected price range and flag when price is extended
All three can be set up and backtested on CoinQuant without code.
Step 1: Choose Your Indicator and Rules
Before opening the platform, define your rules in plain English. This forces you to commit to a logic before you see any results, which removes the temptation to tweak settings after the fact.
A simple Stochastic range strategy might be:
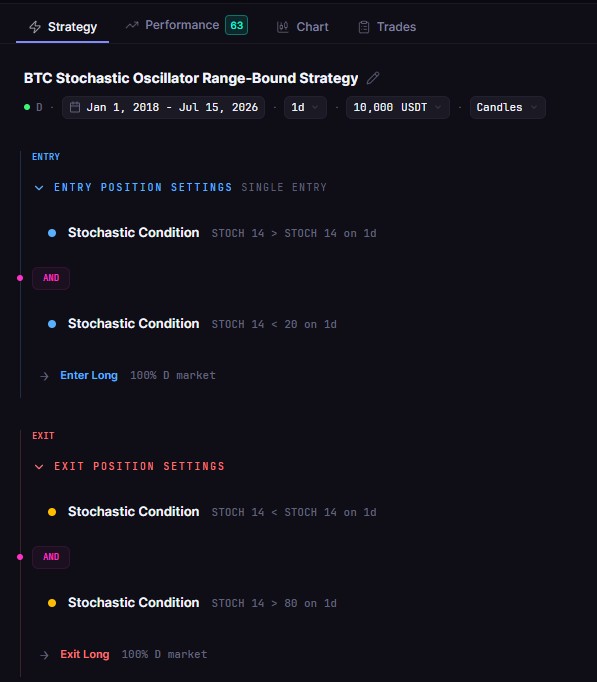
Entry: Stochastic %K (14) crosses above %D (14) on 1d AND Stochastic is below 20 on 1d (crossover into oversold zone , both conditions must be true)
Exit: Stochastic %K (14) crosses below %D (14) on 1d AND Stochastic is above 80 on 1d (reverse crossover out of overbought zone , both conditions must be true)
Market condition: applies best when price is in a consolidation range
Write down the rules. This becomes your hypothesis.
Step 2: Set Up the Strategy on CoinQuant
Log in to CoinQuant and navigate to the strategy builder. You do not need Python or Pine Script. The builder uses plain-language conditions.
Select your instrument. Choose BTCUSDT for the widest data history. For shorter histories, SOLUSDT or ETHUSDT also work.
Set the timeframe. Daily (1D) gives the most statistically meaningful signals. The 4-hour timeframe produces more trades but also more noise.
Add entry condition. Select the Stochastic oscillator with period 14. Add two conditions: (1) STOCH 14 > STOCH 14 on 1d (the %K line crosses above %D) and (2) STOCH 14 < 20 on 1d (price is in oversold territory). Both must be true to trigger entry.
Add exit condition. Mirror the entry logic in reverse: (1) STOCH 14 < STOCH 14 on 1d (the %K line crosses below %D) and (2) STOCH 14 > 80 on 1d (price is in overbought territory). Both must be true to exit the position.
Set position size. Start with 100% of equity per trade to isolate the strategy logic without position-sizing effects.
Step 3: Set the Backtest Period
The backtest period you choose changes the result. This is not a trick or a flaw. It reflects the reality that markets go through different regimes.
For a range trading strategy, use at least two years of data. Ideally, the window should include both trending and ranging market phases so you can see how the strategy behaves in both.
For Bitcoin:
2022 to 2026 (four-plus years): captures the 2022 bear market, the 2023 recovery, the 2024 bull run, and the 2025-2026 consolidation
2018 to 2026 (eight years): captures more full cycles but the earliest years have lower liquidity on spot markets
Set the start date to January 2018 and end date to July 2026 to start. You can always extend or narrow later.
Step 4: Run the Backtest and Read the Results
Click "Run Backtest." The results panel shows the key metrics.
For a range trading strategy, focus on these numbers first:
| Metric | What It Tells You |
|---|---|
| Win Rate | Range strategies typically have higher win rates than trend strategies because small wins are frequent |
| Max Drawdown | The worst peak-to-trough loss. Range strategies can have severe drawdowns if price breaks out of range and keeps going |
| Total Trades | More trades means more data points. Fewer than ten trades makes the result statistically unreliable |
| Total Return | The absolute bottom line. Does the strategy make money over the full period? |
A common mistake is to celebrate a high win rate without checking the total return. A range strategy can win 70% of trades but still lose money if the 30% of losses are large breakouts that run far against the position.
Step 5: Identify Whether the Market Was Actually Ranging
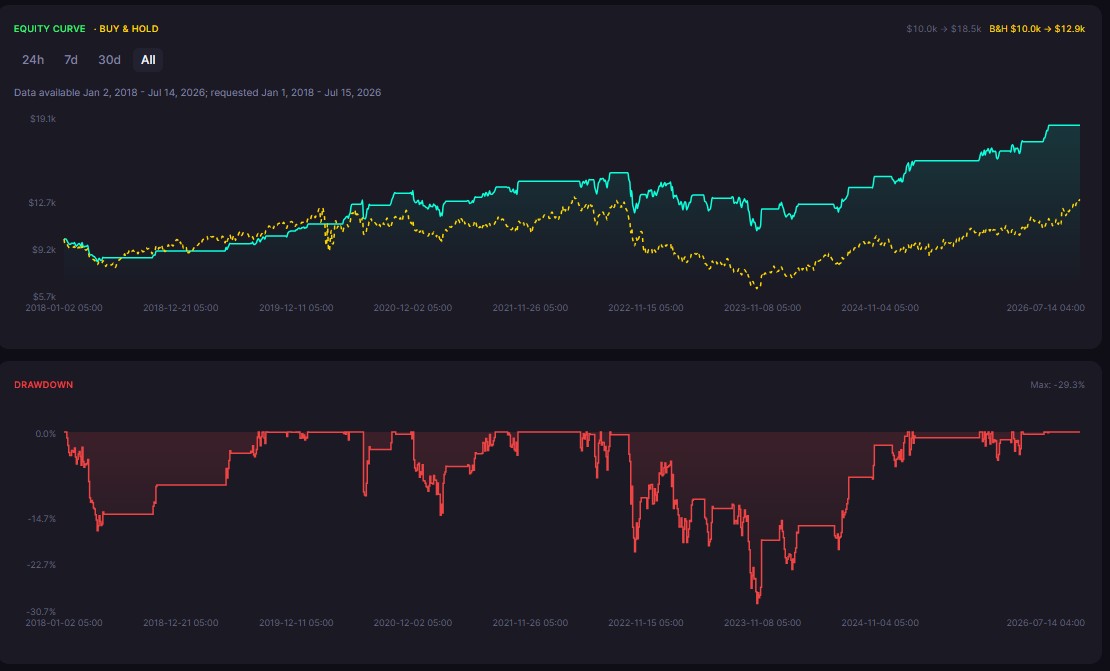
After seeing the results, check the equity curve. A good range strategy should produce relatively steady upward steps with limited drawdown. A jagged equity curve with one or two large drops usually means the strategy was caught by a trend breakout.
The equity curve in CoinQuant shows how the strategy's balance moved over time alongside price. If you see the strategy losing money during a period when Bitcoin was trending strongly in one direction, that is evidence that the strategy has no trend filter and is exposed to breakouts.
What to do if the results disappoint:
Add a price filter: only trade when the 14-period ATR is below a threshold (low volatility = more likely to be ranging)
Narrow the exit: instead of waiting for Stochastic to reach 80, exit at 70
Reduce position size: if the max drawdown is too large, reducing to 50% per trade cuts the drawdown roughly in half while keeping the win rate the same
Each of these changes is a new hypothesis that needs a new backtest.
Common Mistakes When Backtesting Range Strategies
Testing on data that was already ranging.
If you pick a specific period where you know price consolidated, your results will look better than they are. Always test on a period that includes trend phases too.
Ignoring slippage on short timeframes.
On a daily timeframe, slippage is minimal and the 0% default on CoinQuant is reasonable. On lower timeframes with many trades, slippage becomes significant and should be modeled.
Changing parameters after seeing the results.
If the first backtest disappoints, the temptation is to adjust the Stochastic from 20/80 to 30/70 until the numbers look better. That is curve-fitting, not testing. Fix the rules before running, then interpret the result as-is.
A Range Strategy That Actually Has Data
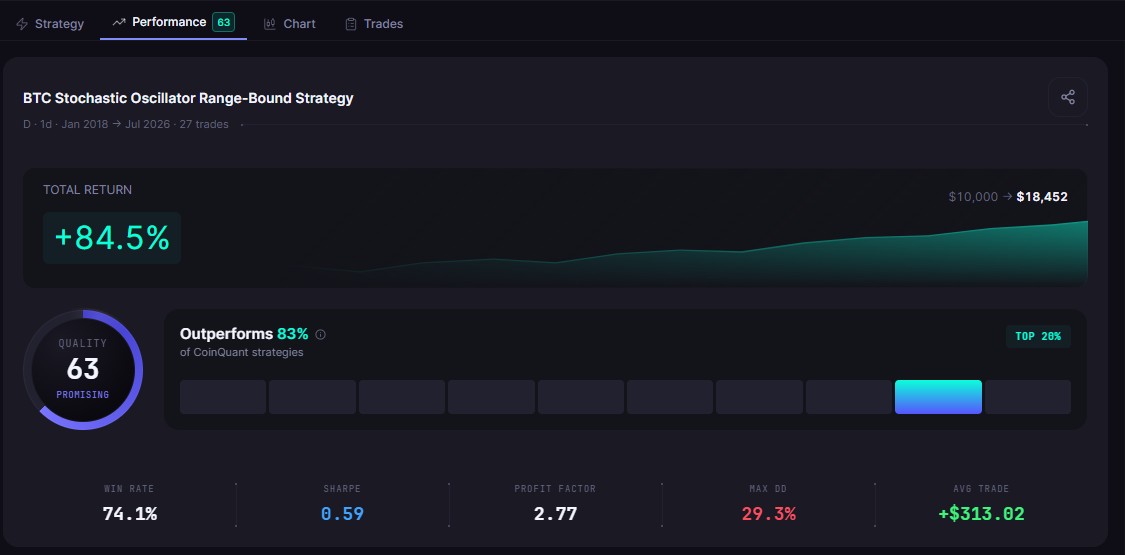
To give this guide a concrete anchor: the BTC Stochastic Oscillator Range-Bound Strategy, backtested on CoinQuant from 2018 to July 2026, produced:
Total Return: +84.5% ($10,000 to $18,452)
Total Trades: 27
Win Rate: 74.1%
Max Drawdown: 29.3%
Sharpe Ratio: 0.59
Profit Factor: 2.77
Quality Score: 63 / Promising (outperforms 83% of CoinQuant strategies)
The 74.1% win rate reflects the typical profile of a range strategy capturing consistent oversold bounces. The strategy won 20 of 27 trades. The 29.3% max drawdown is meaningful but manageable over an 8-year test that included the 2022 bear market. The Sharpe Ratio of 0.59 and Profit Factor of 2.77 confirm the strategy's gains outweigh its losses over the full cycle. The starting capital was 10,000 USDT. The full results and strategy setup are available directly in CoinQuant.
The Right Starting Point
Range trading on crypto requires a framework for identifying when you are in a range, when you are not, and what rules define your entry and exit. None of that requires code.
The process is: define the rules in plain English, set them up in CoinQuant, run the backtest, and read the results honestly. If the results are poor, the problem is usually in the rules, not the tool.
Disclaimer:
Key Takeaway
