
How to Backtest a Crypto Strategy Without Coding (Step-by-Step, 2026)

Most crypto traders hold a strategy idea that has never been tested: a moving average crossover they saw on a chart, an RSI rule from a forum, a gut feeling about Bitcoin's reaction to a news event. The gap between "the idea looks good" and "the idea makes money" is exactly what backtesting exists to close.
The old assumption was that proper backtesting required Python, Pine Script, or a spreadsheet marathon. In 2026 that assumption is obsolete. You can now describe a strategy in plain English, run it against years of institutional-grade market data, and read the full metrics in minutes, with no coding required at any step.
This guide walks through the complete flow on CoinQuant, using a real strategy from the platform's strategy library as the worked example. Follow along and you will have your first backtest result before the end of this article.
What You Need Before You Start
Backtesting without coding still requires thinking. Before opening the platform, decide three things:
The rule: exactly when you enter and when you exit, stated without ambiguity
The asset and timeframe: which market and which candle size
The test window: how far back to run the data
The strategy used here, BTC RSI(14) Mean Reversion 1d, is a real named entry in the CoinQuant strategy library. Its rule is simple: buy Bitcoin when RSI(14) crosses below 30 (oversold), sell when RSI(14) crosses above 50 (back to neutral). It runs long only on daily BTCUSDT with no leverage. It is the same strategy used in CoinQuant's best timeframe study, which makes its verified results easy to cross-check.
Step 1: Write the Strategy in Plain English
The only skill required is describing your idea the way you would explain it to a trading friend. No syntax, no operators, no semicolons.
For the worked example, the description is one sentence:
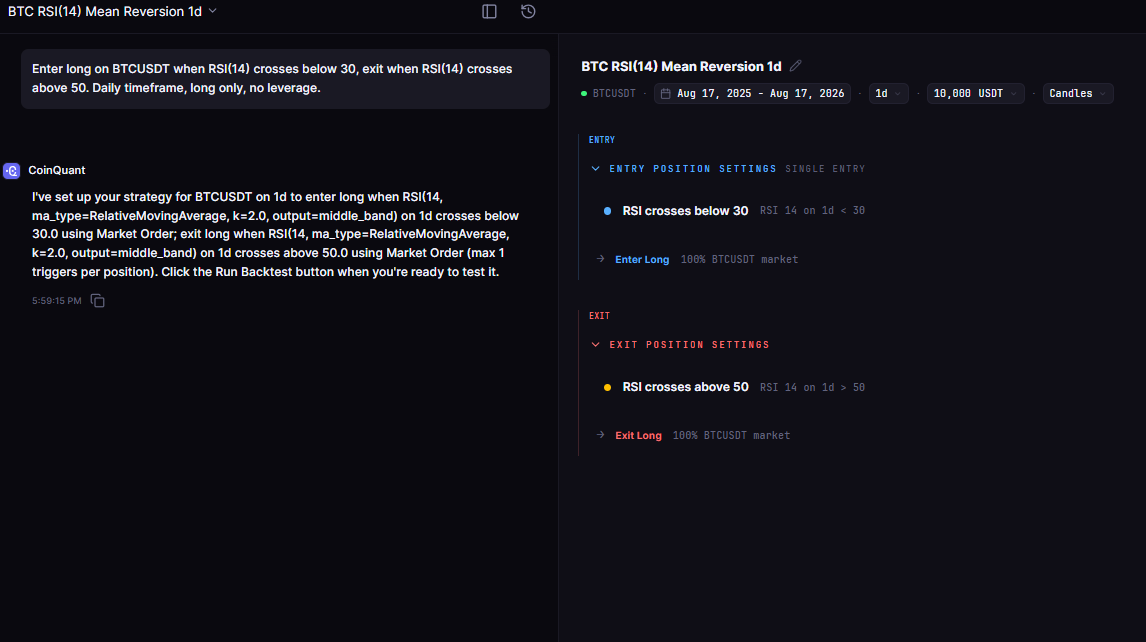
Enter long on BTCUSDT when RSI(14) crosses below 30, exit when RSI(14) crosses above 50. Daily timeframe, long only, no leverage.
Notice what this sentence contains: the asset, the indicator and period, the entry trigger, the exit trigger, and the timeframe. That is the complete specification. If you can write that sentence, you can backtest.
Step 2: Let the Platform Turn Words Into Rules
CoinQuant reads the description and converts it into a structured strategy schema: the indicator series, the comparison operator, the entry action, and the exit action. This is the moment where a no-code platform earns its keep, because the translation from human language to executable logic happens automatically.
Before running anything, review the parsed conditions. Check that the asset says BTCUSDT, the timeframe says 1d, the entry says RSI crosses below 30, and the exit says RSI crosses above 50. This review step matters: the AI will faithfully convert what you typed, so a typo in the sentence becomes a typo in the strategy.
Step 3: Set Up the Test Window and Costs
Two settings decide whether the result means anything: the date range and the fee model.
CoinQuant runs on Kaiko data covering Binance, Coinbase, and Kraken, with Bitcoin history back to 2017. For a mean reversion test on daily candles, a window of at least three to five years includes multiple regimes: bull, bear, and sideways. The verified run of BTC RSI(14) Mean Reversion 1d used a five-year window from August 2021 to August 2026.
Fees are included by default at the 0.1% taker rate, matching Binance standard costs. This is non-negotiable for honest results: a backtest that ignores fees will overstate returns on every trade, and the error compounds with trade frequency. The no-code backtesting guide explains why fee-inclusive testing is the only kind worth running.
Step 4: Run the Backtest
With the strategy parsed and the settings confirmed, run the backtest. The platform processes the rules against the historical bars and returns a full metric report: total return, total trades, win rate, profit factor, Sharpe ratio, sortino ratio, max drawdown, and a quality score that weighs the metrics together.
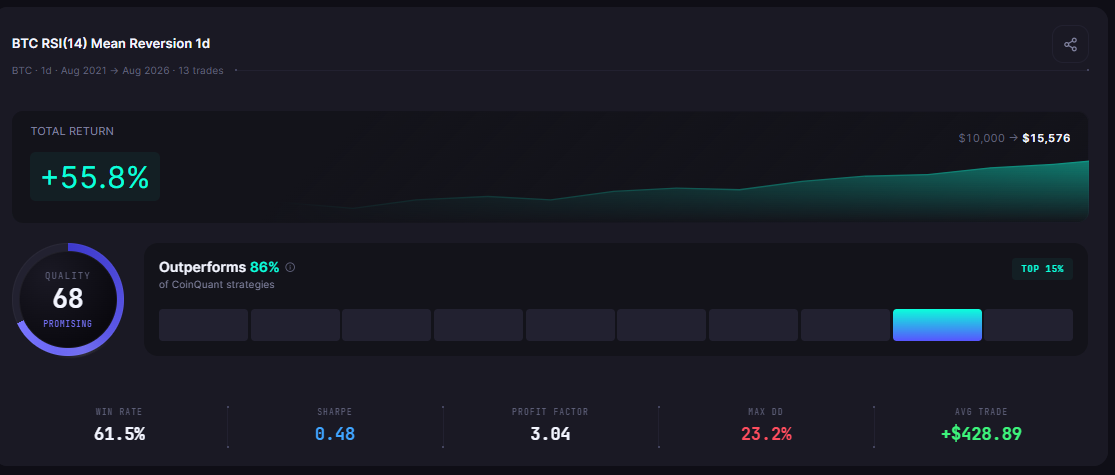
The verified result for BTC RSI(14) Mean Reversion 1d on the five-year daily window:
| Metric | Result |
|---|---|
| Total Return | +55.8% |
| Total Trades | 13 |
| Win Rate | 61.5% |
| Profit Factor | 3.04 |
| Sharpe Ratio | 0.48 |
| Max Drawdown | 23.2% |
| Total Fees | $364.32 |
| Final Balance | $15,575.61 |
The full run is documented in CoinQuant's backtest evidence for the best timeframe study, so the numbers can be checked against a second source.
Step 5: Read the Results Like a Trader, Not a Tourist
The result is a number set, not a verdict. Read it in this order:
Total return and profit factor first. Together they answer the only question that matters: did the strategy make money per unit of risk taken?
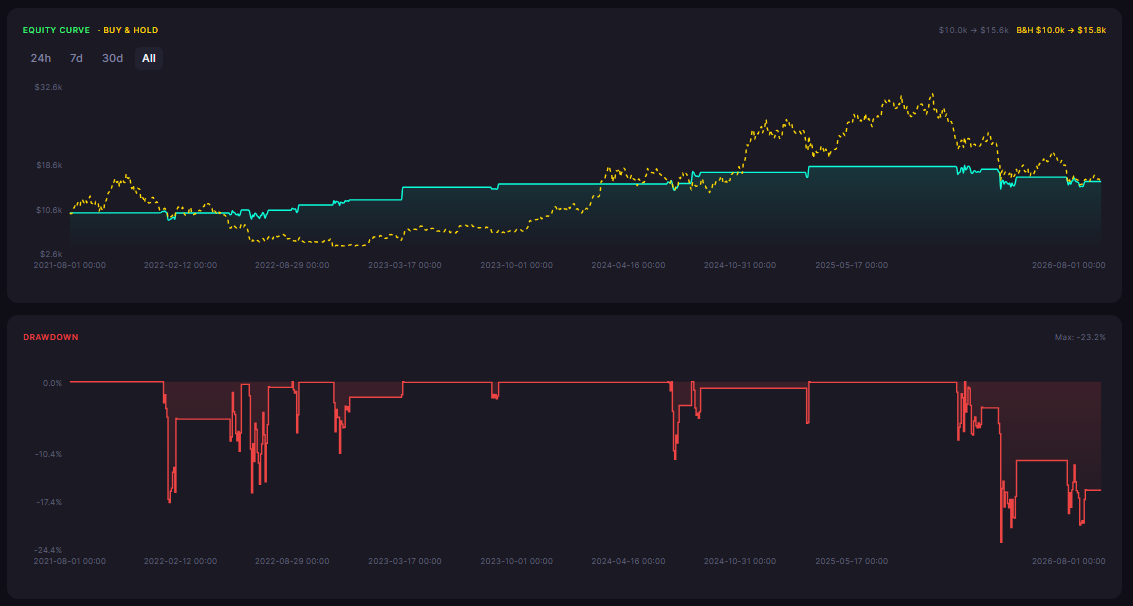
Max drawdown second. Would you have stayed in the trade after watching the account fall 23%? If not, the strategy is wrong for you regardless of the return.
Win rate last. A 61.5% win rate with a profit factor of 3.04 is a strong combination, but a high win rate alone can hide a losing strategy. The how to read backtest results guide covers this ordering in depth.
One practical habit: compare the strategy's ending balance against simply holding Bitcoin over the same window. If the strategy cannot beat buy and hold on a risk-adjusted basis, the complexity is not earning its keep.
Step 6: Iterate With One Change at a Time
The first run is the baseline, not the answer. Change one variable per test: a different RSI exit level, a higher timeframe, a stop loss. Each change gets its own backtest, and the metric report makes the comparison objective.
This is where the test your strategy before going live workflow becomes concrete: every iteration is cheap, fast, and fee-inclusive, so the strategy that eventually reaches a live account has already survived a dozen honest rejections.
The Same Strategy, Six Timeframes
If you want a demonstration of how quickly the workflow pays for itself, the best timeframe study in the CoinQuant library ran this exact RSI rule across six Bitcoin timeframes. The daily version returned +55.8% with a profit factor of 3.04 over five years. The 5-minute version lost 38.3% in four months, almost entirely to fees: 235 trades at 0.1% taker each. Same rule, same asset, same platform, opposite results. The only difference between them is a few settings in the strategy description.
That is the entire argument for learning this workflow: once the pipeline is yours, testing a variation takes minutes, and the platform does the arithmetic. The trader who cannot backtest is stuck with opinions. The trader who can, runs the experiment.
Common Mistakes to Avoid
Testing a one-month window and extrapolating. One month of Bitcoin is one mood, not a market.
Ignoring the fee column. The difference between gross and net results is often the difference between a strategy and a donation.
Changing three settings at once. When the result improves, you will not know which change caused it.
Skipping the parsed-rules review. The AI converts your sentence faithfully; make sure the sentence was right.
The Bottom Line
Backtesting a crypto strategy without coding is a five-step workflow: describe the rule in plain English, review the parsed conditions, set the window and costs, run the backtest, and read the full metric set. The worked example, BTC RSI(14) Mean Reversion 1d, is a real library strategy whose verified five-year run returned +55.8% with a profit factor of 3.04, and any reader can reproduce it in minutes.
The skill that matters is not programming. It is the discipline of reading the drawdown before risking capital, and that discipline is available to any trader who can write one clear sentence.
Disclaimer:
Key Takeaway
