
How Backtesting Software Works in 2026: Data, Fills, Fees, and the Features That Matter

Press run on a backtest and a number comes back. Most traders stop there, but the number is the last step of a pipeline that starts years earlier, when someone recorded a trade on an exchange.
Understanding how backtesting software works is the difference between trusting a result and hoping in one. This guide walks the full pipeline: where the data comes from, how a signal becomes a fill, where fees and slippage enter, and how the report is assembled.
It also covers the features that decide whether the output deserves your attention at all, and how to check each one on the platform you are considering.
How Backtesting Software Works: The Pipeline From Data to Report
Every serious backtesting engine is built on four layers, and a backtest is only as credible as its weakest one:
- Data layer. Historical candles and trades for the instruments you test.
- Strategy layer. The rule set, evaluated bar by bar in a fixed sequence.
- Execution layer. The simulated market where signals turn into fills, with costs attached.
- Reporting layer. The metrics, equity curve, and trade list that come out the other side.
When people ask how backtesting software works, the honest answer is this pipeline. When results look too good, the failure is almost always in the first three layers, not the last one.
Layer 1: The Data Is the Foundation
A backtest begins with recorded history. CoinQuant sources its market data from Kaiko, which aggregates trades from major exchanges including Binance, Coinbase, and Kraken, with Bitcoin history reaching back to 2017.
Three details in the data layer separate usable engines from toys:
- Provenance. You should know which venues the data comes from. Institutional feeds cost more because they clean the records: gaps filled, outliers checked, exchange quirks handled.
- Depth. A brawl over whether a strategy works needs years across more than a bull market. Five years spanning 2021 through 2026 includes a mania, a bear market, and a recovery.
- Granularity. Daily bars are enough for position trading; intraday testing needs resolutions down to at least the 15-minute level. CoinQuant covers 15 minutes to 1 month on standard plans and down to 1-minute candles on Max Power.
The features that matter here are simple to check: does the platform name its data sources, and does it let you test the timeframes and history length your strategy actually needs?
Layer 2: How Signals Become Fills
This is the part traders picture when they think about a backtest, and it is also where look-ahead bias sneaks in if an engine is sloppy.
The rule is mechanical. The engine walks the data bar by bar, in order. At each completed bar it asks one question: are the strategy's entry or exit conditions true right now? When a condition is true, the order goes to the simulated market and gets filled.
Two properties make the difference between a faithful engine and an optimistic one:
- Completed bars only. Signals should be computable from closed candles. If an engine somehow knows a candle's close before the candle is done, it is selling you hindsight.
- Realistic fills. A market order fills at the first available price after the signal, not at the signal price itself. The gap between those two prices is where a lot of fake performance quietly lives.
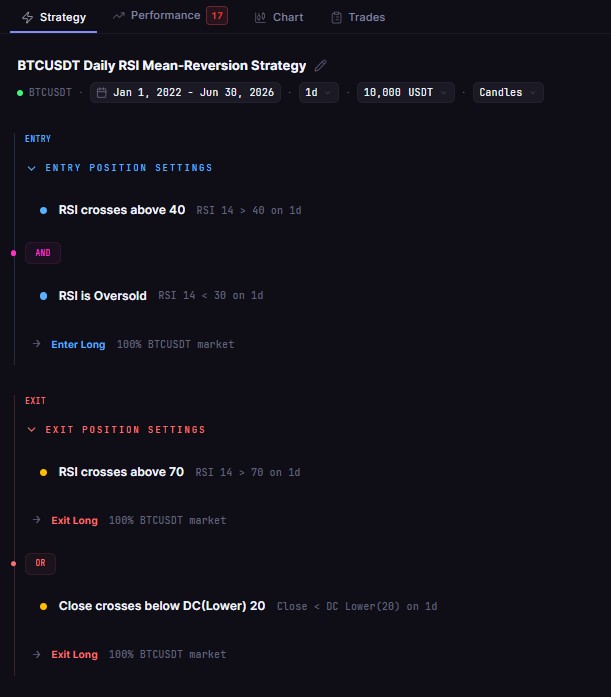
A strategy like "enter long 100% BTCUSDT when RSI(14) crosses above 40 and RSI is oversold, exit when RSI(14) crosses above 70 or the close crosses below DC(Lower) 20" sounds like one decision. In practice it is dozens: each bar re-evaluated, each condition logged, each fill recorded. That is the worked example: the BTCUSDT Daily RSI Mean-Reversion Strategy.
Layer 3: Fees and Slippage, Where Realism Is Won or Lost
A backtest without costs is a fiction, and expensive fiction at that. Every fill on a real exchange pays a fee, and every fast market moves against you a little when you enter.
Serious engines therefore charge every simulated fill at a modeled rate and report the total as its own line item. When you review any backtest, look for the fee total explicitly. If a platform hides or omits costs, assume the headline return is overstated.
Slippage modeling matters twice as much for strategies that trade often. A swing strategy with a dozen trades a year barely notices costs; a fast signal that trades two hundred times across five years pays a tax on every flip. The same logic that makes high-frequency styles expensive in live trading applies inside the backtest, which is exactly the point.
Layer 4: The Report, How Backtests Produce Results
The final layer turns a sequence of trades into the numbers traders judge. Each metric answers a different question:
- Total return answers "how much", with the honest caveat that it hides the path taken to get there.
- Max drawdown answers "how bad did it get", the worst peak-to-trough loss along the way.
- Win rate answers "how often", which is meaningless without the next metric beside it.
- Profit factor answers "how well the wins paid for the losses", the gross profit per dollar lost.
- Sharpe ratio answers "was the return worth the volatility", the risk-adjusted view.
- Total fees answers "what did the activity cost", the after-costs reality check.
Good platforms also let you reproduce a result: same strategy, same settings, same window, same numbers, on demand. Reproducibility is the quiet feature that separates a research tool from a demo.
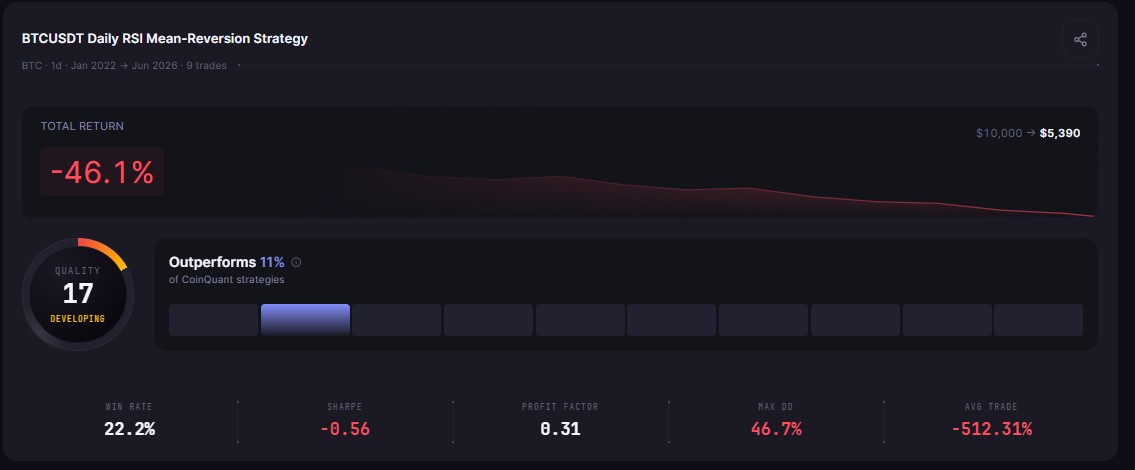
Tested over Jan 1, 2022 to Jun 30, 2026, the BTCUSDT Daily RSI Mean-Reversion Strategy took nine trades and returned -46.1%, turning $10,000 into $5,390, with a 22.2% win rate, a 0.31 profit factor, a -0.56 Sharpe, and a 46.7% max drawdown. On paper, the loss cost nothing to find.
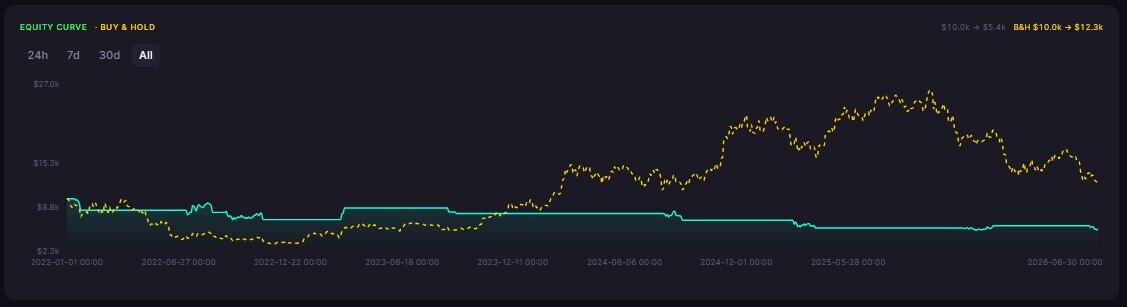
The equity curve makes the gap concrete: the strategy line slides to $5,390 while buy and hold ends at $12,300, up 23% over the same window. That gap is what backtesting exists to surface before real money is risked.
The Checklist: What to Look For in Backtesting Software
When evaluating any platform, run it against this list. Every item is checkable in a single session with a trial account.
| Feature | Why it matters | Quick check |
|---|---|---|
| Named data sources | You cannot trust prices you cannot trace | Look for the data partner in the docs or plan page |
| Fee and slippage modeling | Results without costs flatter every strategy | Find total fees in the report |
| Completed-bar signals | Prevents look-ahead bias | Inspect the trade timestamps for impossible entries |
| Reproducible runs | A result you cannot repeat is an anecdote | Re-run one strategy twice, compare |
| Full metric set | One number never tells the story | Check for drawdown, profit factor, fees together |
| No-code strategy input | Rules should be readable, not hidden in code | Describe a strategy in plain English and rebuild it |
Common Mistakes to Avoid
- Reading the headline only. A strong return with a 70% drawdown is a different proposition than it looks.
- Ignoring the fee line. The faster the strategy, the more this line decides the outcome.
- Testing on a friendly window. A period hand-picked to start after a crash and end at a peak flatters almost anything.
- Judging on fewer than ten trades. Under ten trades, you are reviewing a coincidence with a chart attached.
- Assuming the engine is honest about fills. If look-ahead bias exists, every result built on it is fiction.
The Practical Lesson
- Data, signals, fills, and costs form the pipeline; weakness in any layer corrupts everything downstream
- Costs belong in the result, not in a footnote
- Reproducibility and a complete metric set are the features that separate research from entertainment
- The fastest way to learn how backtesting software works is to take one strategy through the whole pipeline yourself
Backtest your first strategy free and watch the whole pipeline run on CoinQuant. Start your first backtest on CoinQuant
Disclaimer:
Key Takeaway
