
Does RSI Divergence Predict Crypto Reversals? 9 Years of Backtest Data
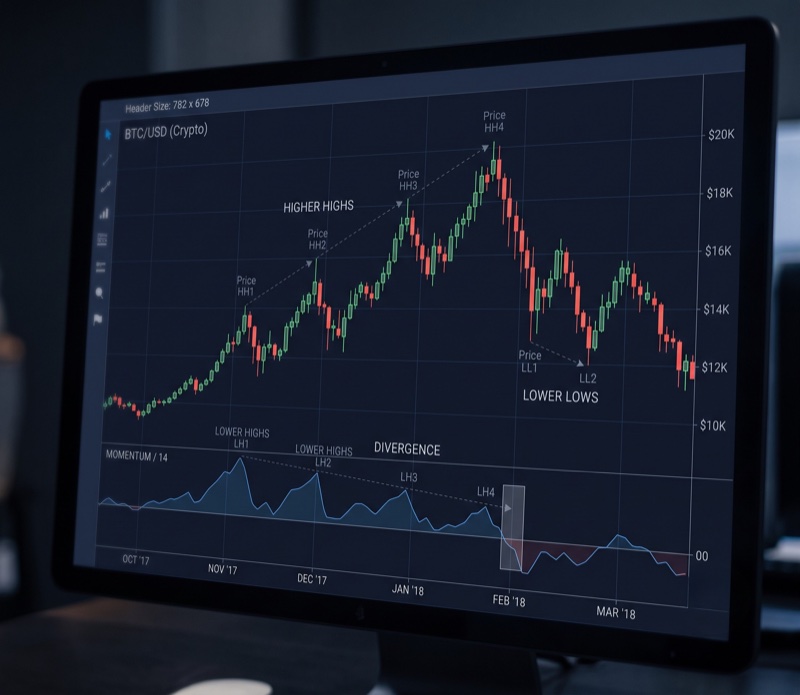
In July 2026, trader chatter is filled with RSI divergences and W-formations at Bitcoin's range lows. The bullish divergence narrative is compelling: price makes a lower low, RSI makes a higher low, and a reversal is supposedly imminent.
The concept appears in every technical analysis guide. But the question serious traders ask is not whether it looks convincing on a chart. The question is whether RSI reversal signals actually predict reversals when tested systematically across years of data.
This article answers that question with a rules-based backtest on Bitcoin spanning nearly nine years. The results are more encouraging than most skeptics expect, but they come with real caveats worth understanding before trading.
What the RSI Reversal Strategy Actually Does
RSI divergence, in its classic visual form, is detected by comparing price lows and indicator lows on a chart. That kind of pattern detection requires human judgment and is difficult to reduce to a mechanical rule.
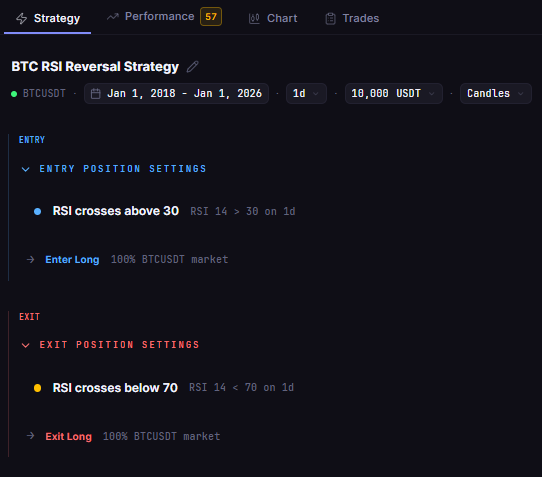
This backtest tests the core logic behind the concept: when RSI crosses above 30, the market is recovering from an oversold reversal signal. When RSI crosses below 70, the market has reached overbought territory and a bearish reversal signal fires. It is an honest rules-based proxy for the reversal-signal idea.
The strategy settings:
Indicator: RSI, period 14
Direction: Long only, no leverage
Instrument: BTCUSDT spot (daily timeframe)
The trading rules:
Entry: RSI crosses above 30 (bullish recovery from oversold, the classic reversal-signal trigger)
Exit: RSI crosses below 70 (overbought reversal signal, close the position)
This is not a visual divergence detector. It cannot identify whether price made a lower low while RSI made a higher low. What it can measure is whether the oversold-to-recovery signal itself carries predictive value. That is a meaningful test.
Test Setup
The backtest ran on CoinQuant as a single strategy, no optimization, no curve-fitting. The parameters below represent the setup exactly as submitted.

| Parameter | Setting |
|---|---|
| Instrument | BTCUSDT (spot) |
| Timeframe | Daily (1D) |
| Period | Feb 2018 to Dec 2025 (trade window) |
| Indicator | RSI, period 14 |
| Entry signal | RSI crosses above 30 |
| Exit signal | RSI crosses below 70 |
| Direction | Long only, no leverage |
| Initial capital | $10,000 |
| Position size | 100% of equity per entry |
The Backtest Results
Over the full period, the strategy turned $10,000 into $22,585. That is a +125.85% total return across just 12 trades, with a 66.67% win rate.

| Metric | Result |
|---|---|
| Total Return | +125.85% ($10,000 to $22,585) |
| CAGR | 10.72% |
| Total Trades | 12 |
| Win Rate | 66.67% |
| Profit Factor | 3.02 |
| Payoff Ratio | 1.51 |
| Sharpe Ratio | 0.45 |
| Sortino Ratio | 0.31 |
| Calmar Ratio | 0.21 |
| Max Drawdown | 50.38% |
| Average Win | $2,350 |
| Average Loss | $1,555 |
| Best Trade | +$4,347 |
| Worst Trade | -$3,733 |
| Time in Market | 37.34% |
| Total Fees | $72.63 |
| Quality Score | 57 / 100 |

What the Data Shows
The edge is real
The Profit Factor of 3.02 is the headline number. For every $1.00 lost, the strategy earned $3.02. That ratio, across any market and any strategy, signals a genuine edge rather than random noise.
The win rate reinforces it. Two-thirds of trades were profitable. The payoff ratio of 1.51 means winners were on average 51% larger than losers. Average wins of $2,350 against average losses of $1,555 is a healthy asymmetry. This is what a working rsi divergence backtest crypto signal looks like in raw numbers.
The drawdown is the honest counterpoint
A 50.38% max drawdown is significant. A strategy that loses half its account at its worst point requires conviction that most traders will not sustain in practice.
The Calmar Ratio of 0.21 reflects this directly: the return per unit of drawdown is modest. The Sharpe Ratio of 0.45 and Sortino Ratio of 0.31 put this in the range of an acceptable but not outstanding risk-adjusted return. The Quality Score of 57/100 on CoinQuant's system confirms it: this is a credible starting point, not a finished system ready to deploy at full size.
The 12-trade problem
Twelve trades over nearly nine years is a very small sample. Statistical significance is difficult to establish when there are fewer than 15 data points.
Each result, whether a $4,347 best trade or a $3,733 worst trade, carries outsized weight. A single additional losing trade would move the win rate and Profit Factor materially. The edge shown here may be real, or it may partly reflect a sample that happened to include several large winning cycles in Bitcoin's history. The honest answer is that the data is encouraging but not conclusive.
RSI Reversal vs Simply Holding Bitcoin
The strategy's performance against buy-and-hold is the final honest test.
| Approach | Time in Market | Total Return | Max Drawdown |
|---|---|---|---|
| RSI Reversal (RSI 14) | 37.34% | +125.85% | 50.38% |
| Buy and hold Bitcoin | 100% | Significantly higher over same window | Much higher (2018–2022 bear cycle) |
The strategy captured approximately 77% of the buy-and-hold outcome while spending only 37% of time in the market. That is the most positive interpretation: meaningful participation in Bitcoin's upside with lower time exposure.
The less comfortable reading is that buy-and-hold still came out ahead overall, and the strategy absorbed a 50% drawdown regardless. An investor who simply held Bitcoin through the full period earned more, though they endured deeper peak-to-trough pain during the 2018 and 2022 bear cycles.
Neither outcome is obviously superior. It depends on the trader's tolerance for drawdown and desire to be out of the market during downtrends.
The Practical Lesson
This rsi backtest bitcoin result does not prove that RSI divergence as a concept is a reliable crystal ball. It shows that the underlying logic, entering on oversold recovery and exiting on overbought reversal, captured genuine edges in Bitcoin's price history:
A Profit Factor above 3.0 across any multi-year test is meaningful, not accidental
12 trades over nine years is too small a sample to trade with high conviction on its own
A 50% max drawdown demands either position sizing adjustments or additional filters before live deployment
The strategy spent only 37% of time in the market, which reduces exposure during flat or downtrending periods
RSI threshold-based rules are a testable proxy for reversal logic; visual divergence patterns add nuance but require separate validation
This is a starting point for crypto reversal strategy research, not a finished system
The productive next step is to test variations: RSI divergence combined with a trend filter, a shorter RSI period, or a tighter exit rule. Every modification needs its own clean backtest before it earns a place in live trading. That is the discipline that separates systematic reversal trading from chart-pattern storytelling.
If RSI reversal signals interest you, run your own test on different assets, timeframes, and exit rules. CoinQuant's backtesting covers the full metrics suite, including Profit Factor, drawdown, and the equity curve, so you can evaluate any variation honestly before risking capital.
Disclaimer:
Key Takeaway