
Directional Movement Index (DMI) Strategy Backtested on Crypto

The most common mistake in trend following is trading when there is no trend. Price chops sideways, moving averages give false crossovers, and traders keep getting stopped out by noise.
The Directional Movement Index was designed specifically for this problem. DMI tells you not just where price is going, but whether a trend is strong enough to trade at all. In July 2026, with traders asking whether Bitcoin is trending or just oscillating, that distinction matters.
This article backtests a pure DMI directional movement index strategy on Bitcoin daily data from February 2018 to March 2026 and reports exactly what happened. The result is a strategy that trades rarely, wins rarely, but lands large when it wins.
What the DMI Strategy Actually Does
The Directional Movement Index was developed by J. Welles Wilder alongside the Average Directional Index. DMI uses two directional lines to identify which side has momentum, and ADX confirms whether a trend is actually present.
The three components are:
+DI (Positive Directional Indicator): measures upward price movement over a lookback period
-DI (Negative Directional Indicator): measures downward price movement over the same period
ADX: the smoothed average of the difference between +DI and -DI, measuring trend strength without direction
Most traders already know ADX as a standalone tool. The DMI crossover system uses the directional lines actively for signals, not just ADX as a filter.
The rules for this backtest are mechanical:
Entry: +DI crosses above -DI AND ADX is above 25 at close
Exit: -DI crosses back above +DI at close
Direction: long only, no leverage, no short trades
ADX threshold: 25 is the standard level that separates trending from non-trending conditions
Test Setup
The backtest ran on CoinQuant as a single strategy on a single instrument. No additional filters, no parameter optimization, no curve fitting. The result reflects the DMI crossover logic exactly as described.
| Parameter | Setting |
|---|---|
| Instrument | BTCUSDT (spot) |
| Timeframe | Daily (1D) |
| Period | Feb 2018 to Mar 2026 |
| Indicator | DMI (+DI/-DI crossover with ADX > 25) |
| Direction | Long only, no leverage |
| Initial capital | $10,000 |
| Position size | 100% of equity per entry |
The Backtest Results
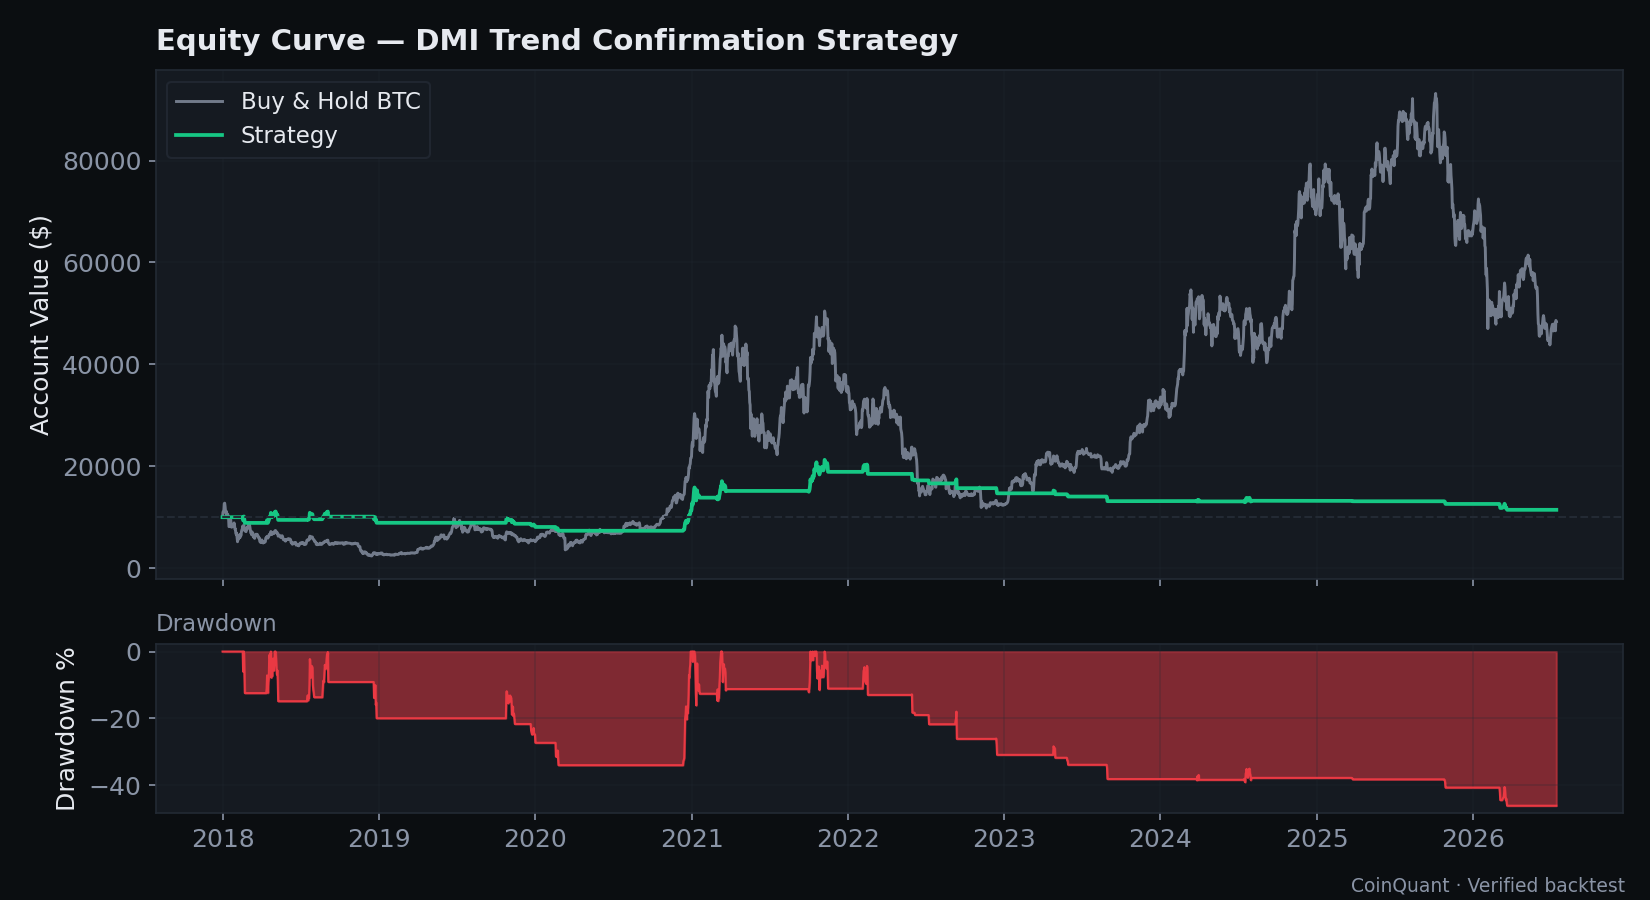
Over the full period, the DMI strategy turned $10,000 into $11,452. That is a +14.52% total return across 27 trades, with a win rate of only 25.93%.

| Metric | Result |
|---|---|
| Total Return | +14.52% ($10,000 → $11,452) |
| CAGR | 1.60% |
| Total Trades | 27 |
| Win Rate | 25.93% |
| Profit Factor | 1.13 |
| Payoff Ratio | 3.22 |
| Sharpe Ratio | 0.18 |
| Sortino Ratio | 0.06 |
| Calmar Ratio | 0.03 |
| Max Drawdown | 46.13% |
| Average Win | $1,845 |
| Average Loss | $573 |
| Best Trade | +$6,497 |
| Worst Trade | -$1,207 |
| Time in Market | 9.36% |
| Total Fees | $137.25 |
| Quality Score | 34 / 100 |
What the Data Shows

Winning rarely but winning large
The most striking feature of this directional movement index backtest is the inversion between win rate and payoff. The strategy won fewer than 1 in 4 trades and still made money. That is because the wins were very large relative to the losses.
The average win was $1,845 while the average loss was only $573. The payoff ratio of 3.22 means every win was worth more than three losses. The best trade returned +$6,497, which is more than half the starting capital in a single entry.
This is what a high payoff ratio strategy looks like in practice. It feels bad to trade because you lose most of the time. But the few wins carry enough weight to put the overall return in positive territory.
The ADX filter kept most of the noise out
The ADX above 25 requirement is the critical component here. Without it, the +DI/-DI crossover would fire on nearly every small directional shift, including the chop that fills most of the Bitcoin chart.
The result of this filter was 9.36% time in market. The strategy was active for less than one month out of every ten. Most crossover signals were rejected because ADX had not confirmed a genuine trend.
This is a highly selective crypto trend strategy. It waited out most of the market's sideways periods and only entered when both the direction and the trend strength were aligned.
The drawdown is still significant
The positives above come with a real cost. The strategy produced a 46.13% max drawdown. For a $10,000 account, that means sitting through a loss of over $4,600 from peak to trough at some point during the test window.
The Sharpe Ratio of 0.18 and Calmar Ratio of 0.03 confirm that the risk-adjusted returns are weak. The strategy produced a positive result, but the return per unit of risk is low. A risk-conscious trader would find this drawdown difficult to sustain.
DMI vs Simply Holding Bitcoin
The strategy made money. But the simplest alternative also made money over this period, and far more of it.
| Approach | Time in Market | Outcome |
|---|---|---|
| DMI trend strategy | 9.36% | +14.52%, 46.13% max DD |
| Buy and hold Bitcoin | 100% | Much larger gain over the same window |
The DMI strategy captured roughly 34% of what buy-and-hold produced over the same period. It sat out most of the market's strongest rallies waiting for confirmed trend conditions.
This is not necessarily a failure. A trader who cannot tolerate large drawdowns might prefer a strategy that is mostly in cash. But the numbers show clearly that selectivity came at a real cost to absolute returns.
The Practical Lesson
This DMI trading backtest demonstrates a specific kind of edge: trend filtering that protects against noise but gives up a large share of the market's upside. The key takeaways are:
A 25.93% win rate can be profitable when the payoff ratio is high enough. Three losers per winner is acceptable if each winner is worth 3.22 losers.
The ADX > 25 threshold did real work. Without it, this strategy would have generated far more trades and likely a worse result.
9.36% time in market is extremely low. This is a patience-heavy approach that most traders will find psychologically difficult to hold.
A 46% max drawdown is still a serious risk. Positive expectation does not eliminate the pain of the losing periods.
The strategy underperformed buy-and-hold over this specific window. That is worth knowing before deploying it.
The right follow-up is to test what happens when you adjust the ADX threshold, add a stop loss, or pair DMI with a higher timeframe trend filter. Each variation needs its own backtest before it earns a place in a live account.
That is the entire point of running a DMI directional movement index strategy backtest before you trade it: you find out whether the edge is real on a chart, not in your account.
Test your own DMI parameters and add your own filters on CoinQuant. Backtest a DMI strategy free on CoinQuant
Disclaimer:
Key Takeaway