
DEMA Crossover Strategy Backtest on Bitcoin: Does Reducing Lag Improve Trend Entries?
Every moving average crossover trader eventually hits the same wall: by the time the fast average crosses the slow one, a chunk of the move is already gone. The problem is called lag, and one of the cleanest attempts to fix it is the Double Exponential Moving Average.
DEMA takes a regular EMA and applies a second smoothing pass engineered to cancel out most of the delay. The line turns sooner, crosses sooner, and reacts faster, which is exactly what a crossover trader wants. The question this article tests: does that extra speed actually improve trend entries on Bitcoin, or does it just trade more often?
The test runs a single DEMA 21/50 crossover strategy on daily BTC from August 2021 to August 2026 and reads the answer against two references: the classic EMA 20/50 crossover in the same library, and simply holding Bitcoin.
What the DEMA Crossover Strategy Actually Does
EMA and DEMA both track average price, but DEMA responds faster by subtracting the lag a plain EMA leaves in the line. Traders use it in crossovers specifically to get earlier entries and exits than the classic EMA setup produces.
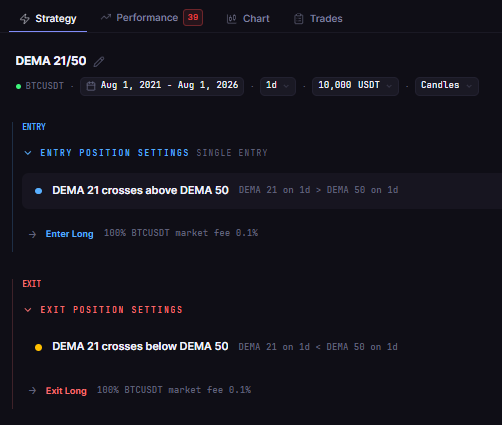
This test uses the standard dual-average crossover structure:
Entry: the 21-period DEMA crosses above the 50-period DEMA
Exit: the 21-period DEMA crosses below the 50-period DEMA
It is long only, one position at a time, no leverage, on BTCUSDT daily. The comparison strategy swaps the two DEMA lines for EMA(20) and EMA(50), the classic fast and slow pairing, so "reducing lag" is the single idea being tested.
Test Setup
| Parameter | DEMA 21/50 (tested) | EMA 20/50 (reference) |
|---|---|---|
| Strategy | BTC DEMA 21/50 Cross 1D 2021-2026 | BTC EMA Crossover 20/50 1D 2021-2026 |
| Instrument | BTCUSDT (spot, Binance) | BTCUSDT (spot, Binance) |
| Timeframe | Daily (1D) | Daily (1D) |
| Tested window | 2021-08-01 to 2026-08-01 | 2021-01-01 to 2026-08-01 |
| Entry | DEMA(21) crosses above DEMA(50) | EMA(20) crosses above EMA(50) |
| Exit | DEMA(21) crosses below DEMA(50) | EMA(20) crosses below EMA(50) |
| Direction | Long only, no leverage | Long only, no leverage |
| Initial capital | $10,000 | $10,000 |
| Position size | 100% of equity per entry | 100% of equity per entry |
| Fees | 0.1% taker, modeled | 0.1% taker, modeled |
| Data source | Kaiko via CoinQuant | Kaiko via CoinQuant |
One note for reading the numbers below: the EMA reference runs on its library strategy's own tested window, which starts in January 2021, five months earlier than the DEMA test. The annualized row (CAGR) and the profile metrics make the comparison as fair as the data allows, and every row is labeled with its exact window.
The Backtest Results
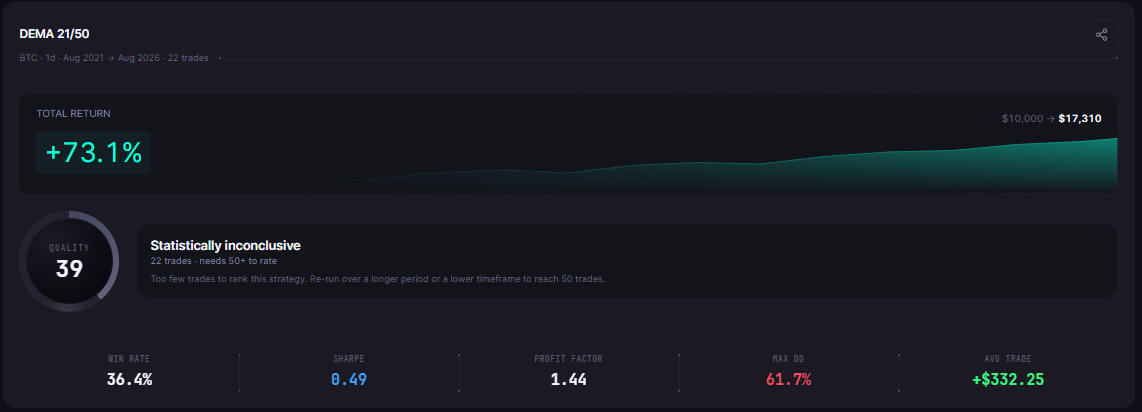
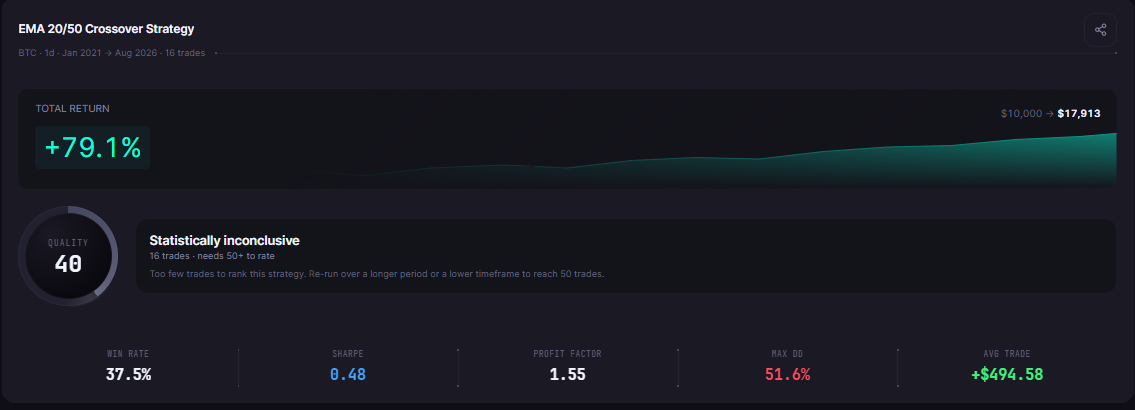
The DEMA crossover turned $10,000 into $17,309.57, a +73.10% total return across just 22 trades.
| Metric | DEMA 21/50 | EMA 20/50 (ref) | Buy and Hold |
|---|---|---|---|
| Total Return | +73.10% | +79.13% | +57.33% |
| Final Balance | $17,309.57 | $17,913.35 | $15,733.43 |
| Total Trades | 22 | 16 | 1 |
| Win Rate | 36.4% (8W / 14L) | 37.5% (6W / 10L) | n/a |
| Profit Factor | 1.44 | 1.55 | n/a |
| Sharpe Ratio | 0.49 | 0.48 | 0.44 |
| Sortino Ratio | 0.72 | 0.70 | 0.63 |
| Max Drawdown | 61.66% | 51.58% | 76.63% |
| Average Win | $2,988.73 | $3,731.55 | n/a |
| Average Loss | $1,185.74 | $1,447.59 | n/a |
| Best Trade | +$7,606.65 | +$8,930.42 | n/a |
| Worst Trade | -$3,061.64 | -$2,999.12 | n/a |
| Time in Market | 48.06% | 46.20% | 100% |
| Total Fees | $573.53 | $458.58 | $25.74 |
| CAGR | 11.59% | 11.01% | 9.48% |
What the Data Shows
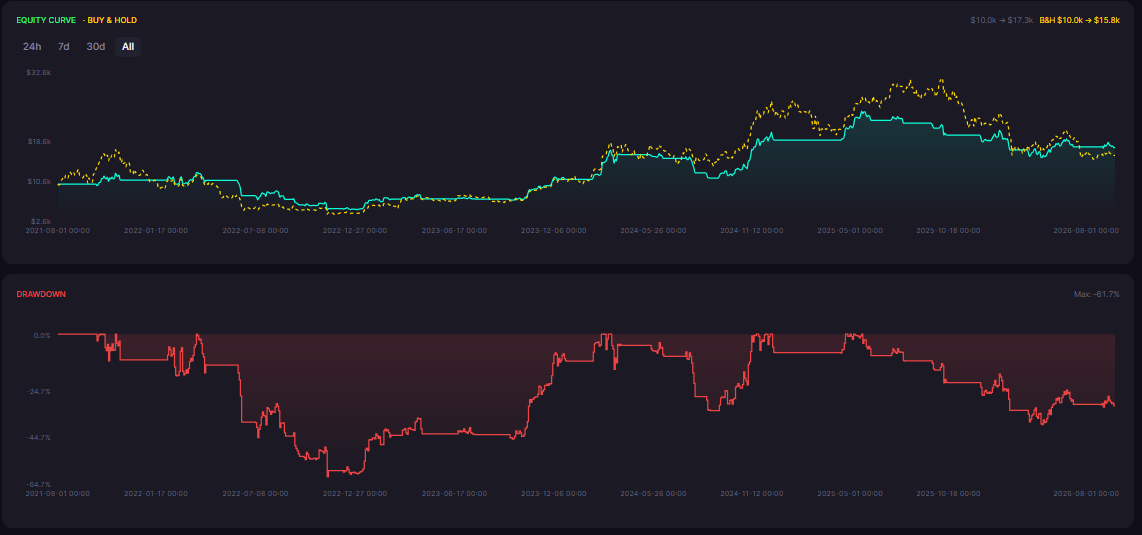
The first clear finding: the DEMA crossover comfortably beat buy and hold. +73.10% against +57.33% over the same window, with a shallower drawdown (61.66% versus 76.63%), roughly half the time in the market, and only $573.53 in fees against a full five years of exposure. As a filtering machine for Bitcoin's worst phases, the crossover earned its keep.
The second finding is where the "reduced lag" story gets complicated. Against the EMA reference, the DEMA's annualized return is slightly ahead, 11.59% versus 11.01%, but almost everything else tilts the other way: six more trades, a deeper maximum drawdown (61.66% versus 51.58%), a lower profit factor (1.44 versus 1.55), and a lower average win. The faster average produced earlier signals, and earlier signals on daily Bitcoin cut both ways.
The third finding is the shape of the equity path, which is the classic trend-follower signature. The year-by-year trade ledger shows 2022 as the painful stretch, with -$5,740.24 across five trades as the bear market ground the averages into repeated false crossings. The recovery came from a few large captures: +$5,870.36 in 2023 and +$7,880.66 in 2024, including the single best trade held from mid-September to late December 2024 for +$7,606.65.
Why Lower Lag Is Not Automatically Better
Demand for DEMA comes from a real complaint: EMA crossovers give back the first part of every move. That is true, and the DEMA does enter earlier. On this window, though, the earlier entries also arrived with more false starts, and the drawdown gap (61.66% against 51.58%) is the price of those extra signals.
The mechanism is simple. A faster line turns sooner on real turns, and it also turns sooner on noise that a slower line ignores. Over five years of daily Bitcoin data, those two effects roughly canceled in return terms and cost a little in risk terms. The popular claim that lower lag improves trend entries is not wrong; it is just incomplete. Lower lag shifts where you enter and exit, and on this test the shift was a wash rather than a win.
None of this makes either crossover a bad strategy. Both beat the 9.48% annualized outcome of buy and hold while spending roughly half of the time in the market, which is what systematic trend following is supposed to do. It just means the DEMA choice should be made for the right reason, which is preference over trade timing, not an assumption of superiority.
The Practical Lesson
The DEMA 21/50 crossover returned +73.10% on daily BTC over five years, beating buy and hold's +57.33% with a shallower drawdown and $573.53 in total fees
Against the EMA 20/50 reference, DEMA's annualized return was slightly higher (11.59% versus 11.01%) but it traded more (22 versus 16 trades) and drew down deeper (61.66% versus 51.58%)
Lower lag changed the entry and exit points; on this window it did not improve the risk-adjusted outcome versus the classic EMA setup
The profile is standard trend following: steep losses in 2022, profits from large trend captures in 2023 and 2024
The lag question has a measured answer for this window: DEMA is a legitimate crossover tool that held its own against both benchmarks, and it delivered the faster response it promises. What it did not deliver is a free improvement, because the same speed that enters earlier also exits earlier when the market only pretended to turn. Traders choosing between the two should test both setups on their own window and judge on the profile they can actually hold, not on the label.
Run this DEMA backtest yourself and test your own moving average settings on CoinQuant. Backtest trend strategies free on CoinQuant
BACKTEST VERIFIED: Article 267 Strategies (BTCUSDT 1D): BTC DEMA 21/50 Cross 1D 2021-2026 (strategy_version_id c61c3d9e-e741-422e-a955-d5f7cddefa48, backtest_id c58fc570-465b-4227-8326-82f7b0762cd9, window 2021-08-01 to 2026-08-01, TR +73.10%, 22 trades, 36.4% win, PF 1.44, Sharpe 0.49, DD 61.66%, fees $573.53, final $17,309.57); BTC EMA Crossover 20/50 1D 2021-2026 (strategy_version_id c726f52c-b463-4207-bd55-d2c589c357e6, backtest_id 798ac488-d525-4ec6-a477-779a388946fc, window 2021-01-01 to 2026-08-01, TR +79.13%, 16 trades, 37.5% win, PF 1.55, Sharpe 0.48, DD 51.58%, final $17,913.35); BTC Buy and Hold 1D 2021-2026 (strategy_version_id 041920f4-a649-4247-82fd-15b6c2b2bdda, backtest_id 6c76316d-ca56-4013-a54e-cf2d4ee4460b, window 2021-08-01 to 2026-08-01, TR +57.33%, 1 trade, DD 76.63%, final $15,733.43). All metrics confirmed via GET /v1/backtests/{id}/results on 2026-09-16.
Disclaimer:
Key Takeaway
