DCA Strategy on Bitcoin: What 5 Years of Backtesting Actually Reveals
.png)
Five years of Bitcoin price data contains three bull markets, one devastating bear market, and several corrections that wiped out leveraged traders. Before committing capital to a systematic buying approach, the question is simple: what do the numbers show? This article tests a systematic dip-buying strategy on Bitcoin across January 2021 to June 2026 and reports every metric without adjustment.
What a Systematic Dip-Buying Strategy Is
Dollar-cost averaging is the practice of buying a fixed amount of an asset at regular intervals regardless of price. The logic is behavioral as much as financial: by removing timing decisions, you avoid buying euphoria and selling panic. Over long periods, you accumulate more units when prices are low and fewer when prices are high.
Testing pure time-interval DCA requires a time-based trigger. CoinQuant uses indicator-based entry conditions, so this backtest uses the closest systematic proxy: an RSI dip-and-recovery signal on the daily chart. The strategy enters when RSI(14) crosses back above 35 after dropping below it, and exits when RSI(14) reaches 70. This captures the same intent: enter after a confirmed momentum low, exit into strength.
The RSI threshold of 35 was chosen as a middle ground between sensitivity and selectivity:
RSI 30 (traditional oversold level): Would have generated fewer signals, requiring a deeper selloff before the strategy enters. Fewer signals mean fewer opportunities to capture the recovery when the market bounces back.
RSI 40: Would have entered more frequently but taken more false positives in choppy, sideways conditions where there is no genuine trend reversal underneath the dip.
The 35 crossback approach requires a meaningful momentum drop, not simply a sideways drift, before a position opens. It is more selective than a calendar-based DCA without requiring the extreme oversold depth that RSI 30 demands.
The strategy is long-only, systematic, single-entry per signal. No leverage. No shorts. Initial capital $10,000.
Strategy Setup on CoinQuant
Instrument: BTCUSDT
Timeframe: Daily
Entry: RSI(14) crosses above 35 after dropping below 35
Exit: RSI(14) crosses above 70
As a plain-English prompt in CoinQuant: "Long-only BTCUSDT daily. Enter when RSI(14) recovers above 35 from oversold. Exit when RSI(14) reaches 70. Backtest January 2021 to June 2026."
.jpeg)
Backtest Results: January 2021 to June 2026
The backtest ran on BTCUSDT daily candles from January 1, 2021 to June 1, 2026. Data sourced through Kaiko via CoinQuant. Trading fees of 0.1% per trade included. No leverage applied.
What the Results Tell You
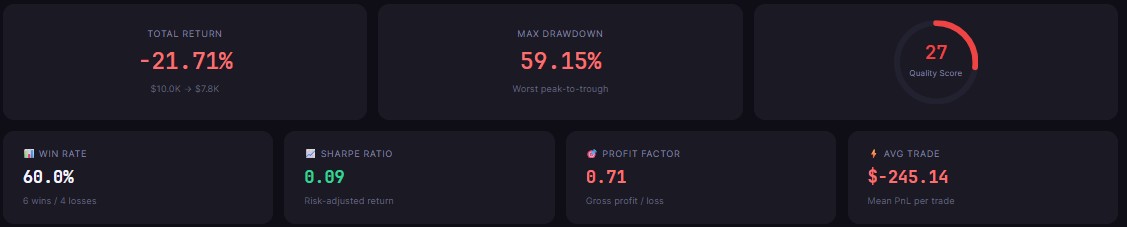
A 60% win rate across 10 trades means six of the ten signals closed profitably. The -21.71% total return reflects the combined effect: four losing trades, primarily triggered during the 2022 bear market and the 2026 correction, produced larger losses than the six winners generated in profits.
The -59.15% max drawdown is the critical number. At one point during the 5-year test, the strategy was sitting on a paper loss of nearly 60% from peak equity. This happened during the 2022 bear market: the strategy entered long, and Bitcoin continued lower for months before recovering.
Three things this backtest reveals about systematic buying on Bitcoin:
Win rate above 50% confirms the dip-recovery signal fires correctly more often than not. The problem is the size of the losses when it does not.
The 2022 bear market dominates the result. Any systematic strategy that bought BTC in 2022 took heavy losses before the recovery. A stop-loss layer would have limited the max drawdown significantly.
With only 10 trades over 5.4 years, the strategy spends most of its time in cash. Return per year is compressed by the low frequency.
Context matters for interpreting these results honestly. The 2021 to 2022 period covered two distinct market regimes: a major bull run through November 2021 where BTC peaked near $69,000, followed by a bear market that erased roughly 75 percent of that gain by November 2022.
Any long-only strategy running through both of these phases faces the same structural asymmetry: gains accumulated during the bull run are partially erased during the drawdown if exits do not trigger cleanly in time.
The RSI 70 exit threshold captured some of the upside but not all. In rapid parabolic moves, price can sustain above RSI 70 for extended periods before the indicator generates a clean crossover signal, causing the strategy to hold past the optimal exit point.
The average trade in this backtest lasted roughly two to three weeks, long enough for a swing recovery to develop, short enough that the strategy does not stay exposed through entire market cycles.
In the trades that closed profitably, the recovery pattern was consistent: RSI dropped below 35 on a sharp daily candle, buying volume returned within days, and price recovered to the prior range high within two to four weeks, triggering the RSI 70 exit.
The losing trades followed a different pattern: RSI appeared to cross back above 35 briefly after an initial dip, then broke down further in a trend continuation: the classic false recovery signal that occurs during macro bear phases when selling pressure has not yet exhausted.
The Honest Case for Systematic Strategies
A -21.71% return looks poor compared to BTC buy-and-hold, which produced results ranging from negative (if you bought the 2021 peak) to highly positive (if you bought the 2020 lows). The value of a systematic strategy is not in consistently beating spot performance. It is in giving you a framework to test, improve, and manage.
The purpose of running this backtest is not to judge the result as a final verdict on the strategy. It is to establish a measurable starting point.
When you run the same strategy with an RSI entry threshold of 30 instead of 35, you get a different trade log with fewer entries and fewer false signals. When you add a 200-day EMA filter that restricts entries to periods when price is above the long-term average, you eliminate most 2022 entries, precisely the ones that contributed the largest drawdown.
Each of those changes produces a new set of numbers to evaluate. The five-year dataset stays fixed; only the parameters change. That is what systematic testing actually looks like: iterative, measurable, and grounded in the same historical record.
Every parameter here is adjustable. Changing the RSI threshold from 35 to 30 filters out shallow dips. Adding an EMA trend filter prevents entries during confirmed bear markets. Each change can be tested against the same five-year dataset before any capital is at risk.
Three specific adjustments are worth testing, in order of expected impact on this strategy's performance:
Lower the RSI entry threshold from 35 to 30: A deeper required dip reduces trade frequency but filters out entries that form at shallow bounces in a declining market: the entries most likely to become the strategy's worst trades.
Add a 200-day EMA trend filter: Only enter long when the daily close is above the 200-day EMA. This single rule would have blocked most of the 2022 entries, since Bitcoin traded well below its 200 EMA for the majority of that year.
Replace the fixed RSI 70 exit with a trailing stop set at 15 percent from the highest post-entry close. A trailing stop locks in gains as price rises and caps the loss if the trade reverses after entry, reducing the magnitude of the worst losing trades without eliminating upside on the winning ones.
Each of these changes is testable in minutes on the same five-year dataset.
Run this backtest and adjust the parameters on CoinQuant. No coding required.
Start free on CoinQuant
Disclaimer:
This content is for educational and informational purposes only and does not constitute financial, investment, or trading advice. All strategies and examples are for illustrative purposes and do not guarantee results. Always conduct your own research before making financial decisions.
Key Takeaway