Crypto Scalping with Bollinger Bands: 3 Months of 5-Minute Backtests on ETH
.png)
Bollinger Band scalping is one of the most popular short-term setups in crypto trading. The logic is mechanical, the entries are rule-based, and ETH generates enough volatility to trigger signals constantly. But a bollinger band scalping strategy backtest tells you more than theory ever can. We ran this exact setup on ETH/USDT using 5-minute candles over three months of institutional-grade market data. The results: 519 trades, a 66.47% win rate, and a +11.91% total return. Here is what the data shows, and where the strategy breaks down.
How Bollinger Band Scalping Works
Bollinger Bands plot three lines around price: a middle line (a 20-period simple moving average), an upper band, and a lower band. The upper and lower bands sit two standard deviations above and below that middle line. When price moves outside those bands, it has deviated significantly from its recent average.
Bollinger Band scalping exploits mean reversion. When price dips below the lower band, the setup reads that as a temporary oversold spike and enters long. The target is not a breakout or trend continuation: it is a return to the mean, captured by the middle band.
The appeal is clear: high trade frequency, short holding periods, and fully mechanical signals with no discretion. The risk is equally clear: when price breaks the lower band in a genuine downtrend, mean reversion can take longer than expected.
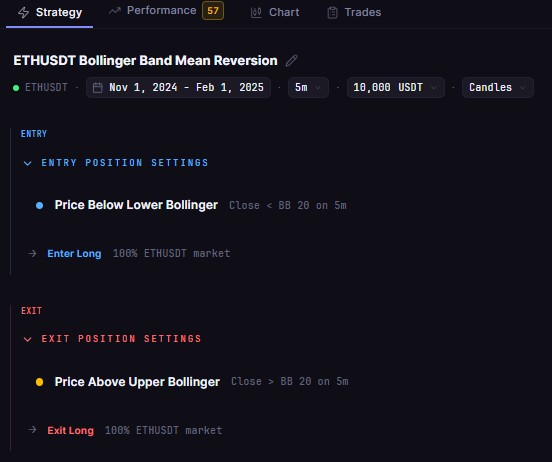
The Strategy Setup
This backtest tested a long-only mean reversion setup on ETH/USDT with the following parameters:
Entry signal: price crosses below the lower Bollinger Band (20-period, 2 standard deviations)
Exit signal: price crosses back above the middle band (20-period SMA)
Position sizing: 100% of available capital per trade
Max open positions: one at a time
No stop-loss applied; pure mean reversion to the middle band
The setup is conservative on the exit side. Targeting the middle band rather than the upper band keeps the take-profit closer to entry, which increases hit rate but reduces average profit per winner. The tradeoff is intentional: more frequent small wins over fewer larger ones.
Backtest Configuration
Three months of live 5-minute candles on one of the most actively traded pairs in crypto. No optimization or parameter tuning was applied. This is a single clean run on standard Bollinger Band defaults.
3-Month Results on ETH
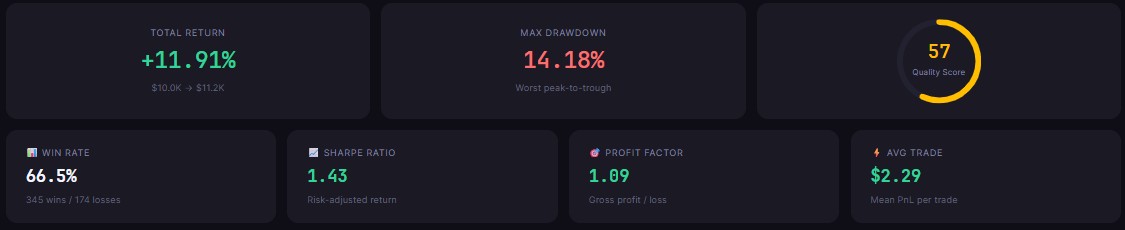
+11.91% over three months is a solid result for a single-indicator, no-optimization scalping strategy. On a $10,000 account, that is $1,191 in net profit after 0.1% taker fees across all 519 trades. The fee drag across 519 round-trips is meaningful: at 0.1% taker per entry and exit, the strategy paid roughly $1,038 in total fees and still returned positive.
The 66.47% win rate is the headline number. Two out of every three trades closed profitable. That is above the threshold most retail scalpers realistically achieve, and it held up across a three-month period that included three distinct market regimes: a strong November rally, a December peak and distribution, and a January pullback.
The 519 total trades average roughly six setups per day. Crypto markets run 24 hours, and ETH on 5-minute candles touches the lower Bollinger Band frequently enough to generate consistent signal flow without overtrading.
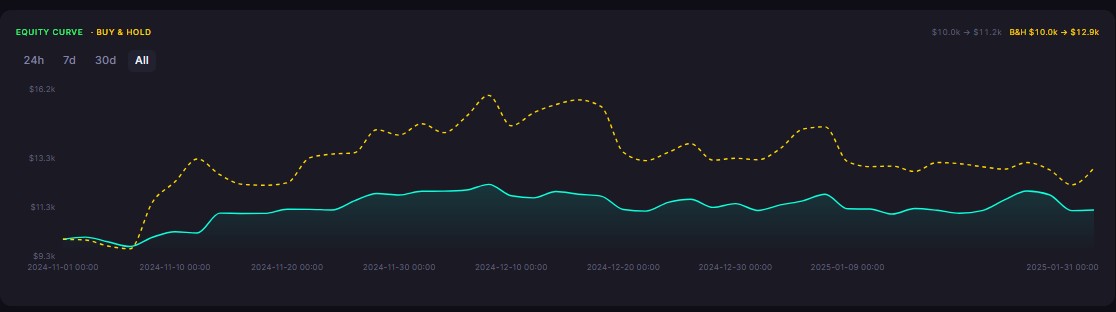
The 14.18% max drawdown requires honest context. The backtest period (November 2024 through January 2025) captured the post-election crypto bull run. ETH moved sharply from around $2,400 to above $3,600 in December before pulling back. Trending conditions are the natural enemy of mean-reversion setups: when price breaks below the lower band during a sustained downward move, it can remain there for multiple candles before recovering. The 14.18% drawdown reflects those moments. In dollar terms on $10,000 capital, that is a $1,418 paper loss at the deepest point. The strategy recovered and closed the period in positive territory.
What the Trade-by-Trade Data Reveals
Several patterns stand out from a 519-trade dataset.
The edge is consistent across regimes. The 66.47% win rate held across low-volatility consolidation, the November-December rally, and the January correction. A win rate that survives three distinct phases suggests the mean-reversion edge is genuine rather than a product of favorable timing.
Conservative exits drive the win rate. Exiting at the middle band rather than the upper band keeps targets short. This produces smaller average profits per winner but a significantly higher hit rate. Traders wanting larger individual winners can test exiting at the upper band, but expect a lower win rate in exchange.
No stop-loss is the biggest structural risk. Every losing trade in this dataset held until price eventually crossed the middle band from below or the backtest period ended. In a sharp, sustained trend lower, those positions bleed capital during the hold period. Adding a stop-loss at a fixed distance below entry (for example, 1.5 times the current band width) would reduce the win rate but cap worst-case drawdowns per trade. That variation is worth testing separately.
The period context strengthens the result. November 2024 to February 2025 was one of the most directional stretches in recent crypto history. A long-only mean-reversion scalper posting 11.91% profit and a 66.47% win rate inside a trending bull-then-pullback environment is a more credible outcome than the same numbers in a flat, range-bound market.
Run This on CoinQuant
This entire backtest ran inside CoinQuant, an AI trading platform, in under two minutes. No coding required. No Python. No Pine Script.
The process:
Describe the strategy in plain language
CoinQuant translates it into a structured logic schema
Run the backtest on Kaiko institutional data sourced from Binance via CoinQuant
Review results instantly in the dashboard
From that baseline, modifications take seconds: change the BB period to 14 or 50, adjust the standard deviations from 2.0 to 1.5, add a stop-loss rule, switch from ETH to BTC or SOL, or extend the backtest window. Each variation runs as a new independent backtest without touching a line of code.
The 519-trade result in this article is reproducible by anyone with a CoinQuant account. The same setup, the same period, the same parameters.
Disclaimer:
This content is for educational and informational purposes only and does not constitute financial, investment, or trading advice. All strategies and examples are for illustrative purposes and do not guarantee results. Always conduct your own research before making financial decisions.
Key Takeaway