
CCI Strategy on Solana: 12 Months of Backtest Data Across Bull, Bear, and Range Markets
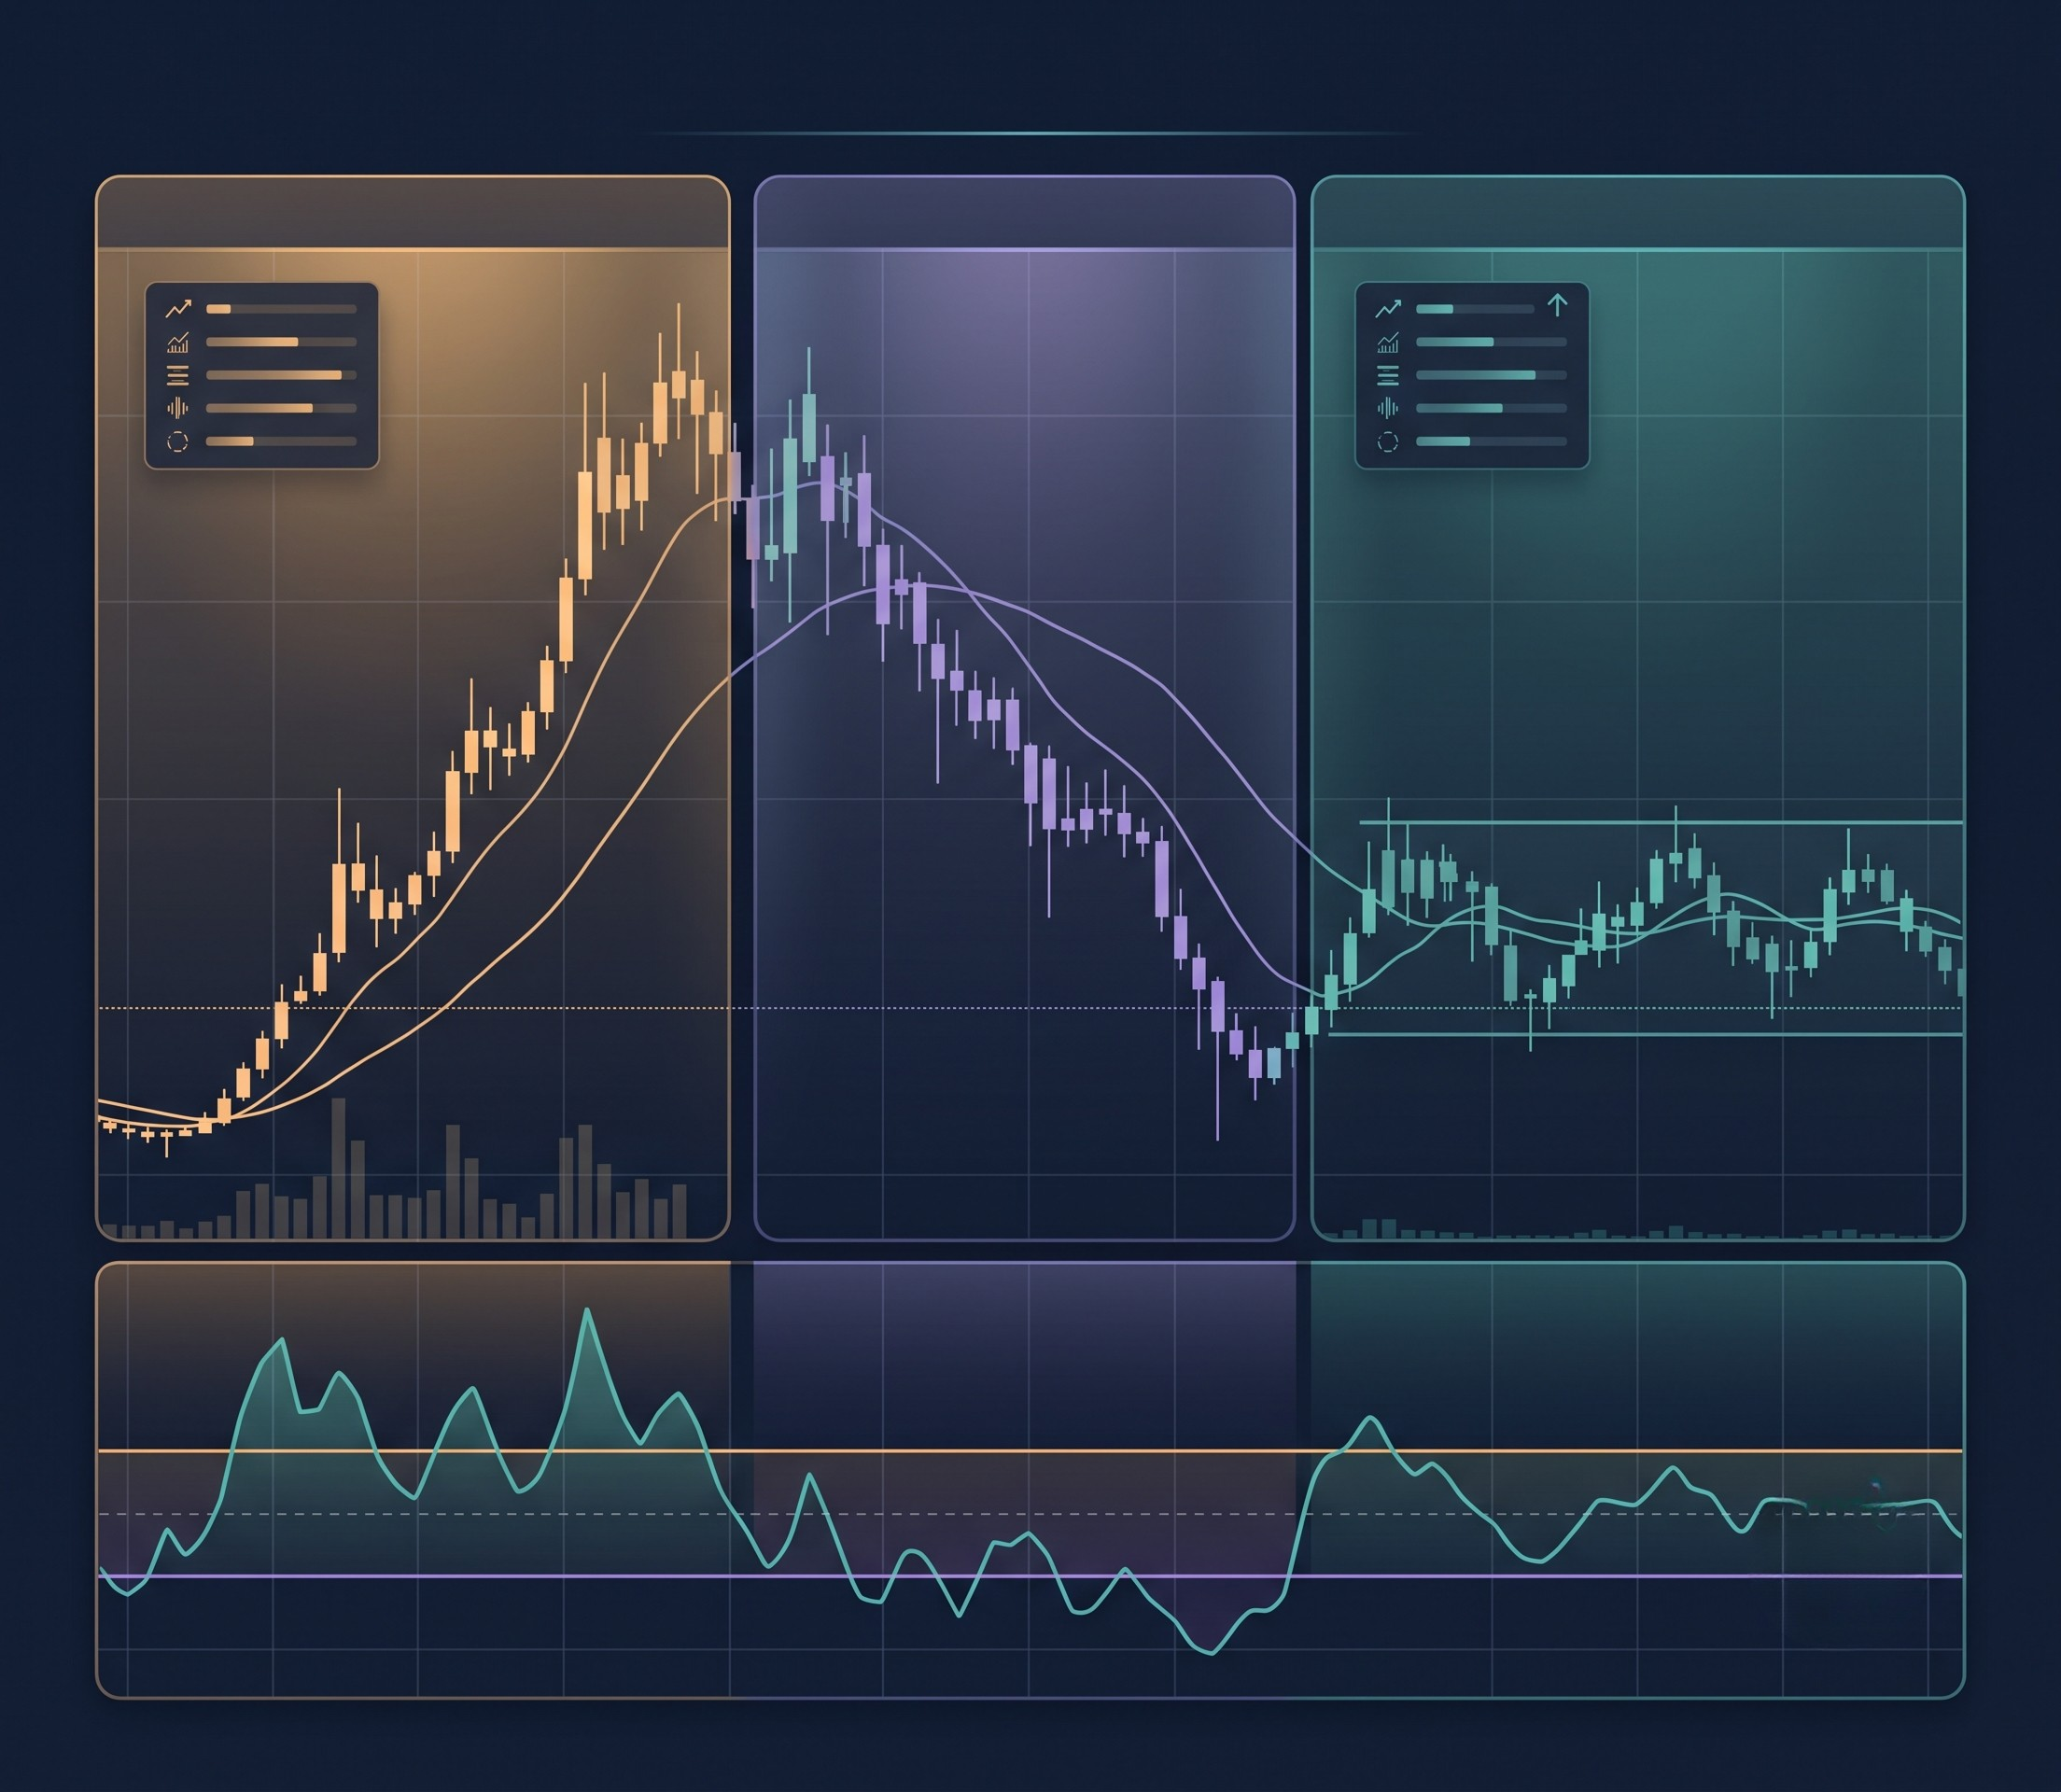
Solana and Bitcoin share an oscillator toolkit but not a price profile. SOL is a younger asset with higher volatility, sharper intraday swings, and a shorter history of sustained trend behavior. When a signal works on Bitcoin, it does not automatically work on Solana, because the underlying price dynamics that the signal was designed to detect are different.
This article tests a CCI(20) oscillator strategy on Solana across daily and four-hour timeframes and compares the results directly against the BTC CCI backtest covered in Article 166. The question being answered is specific: does Solana's higher volatility rescue a CCI momentum signal that struggled on Bitcoin, or does it deepen the losses?
CoinQuant backtest data covers August 3, 2025 to August 3, 2026. Fees and slippage are included in all results.
What the CCI(20) Range Oscillator Strategy Does
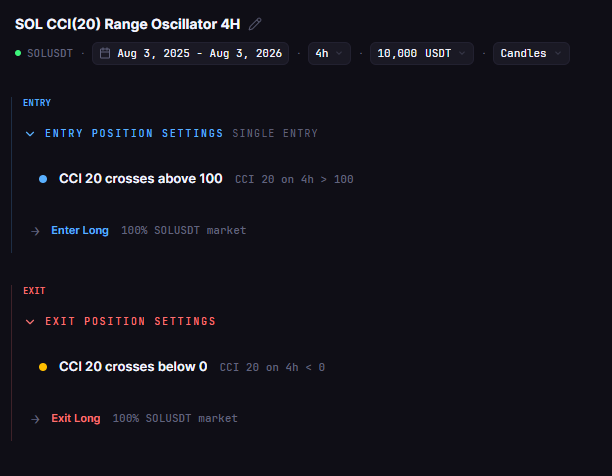
The Commodity Channel Index on Solana follows the same mechanical rules used in the Bitcoin test. CCI(20) measures the deviation of the typical price from a 20-period simple moving average, scaled by a constant fraction of the mean absolute deviation. The resulting oscillator identifies when price is trading unusually far above or below its recent average.
The strategy logic:
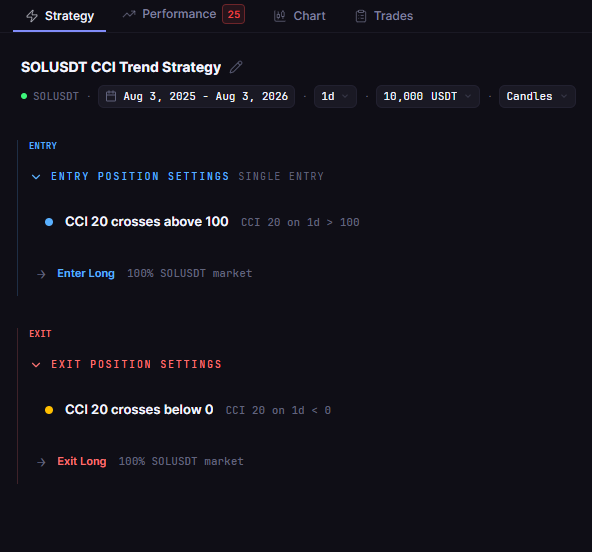
Entry: Long when CCI(20) crosses above +100
Exit: Long when CCI(20) crosses back below 0
The +100 threshold signals that Solana is in a strong upward push relative to its recent range. The exit at zero returns the strategy to cash when that momentum returns to neutral. Long-only, no leverage, no additional confirmation filters. The same rules are applied to both the daily and four-hour timeframes to test whether Solana's volatility characteristics change the outcome relative to Bitcoin's.
Test Setup
| Parameter | Value |
|---|---|
| Asset | SOLUSDT (Binance Spot) |
| Indicator | CCI, 20-period |
| Timeframes Tested | Daily (1D), Four-Hour (4H) |
| Test Window | August 3, 2025 to August 3, 2026 |
| Fees and Slippage | Included |
| Data Source | Kaiko via CoinQuant |
SOL CCI Results: Daily and Four-Hour
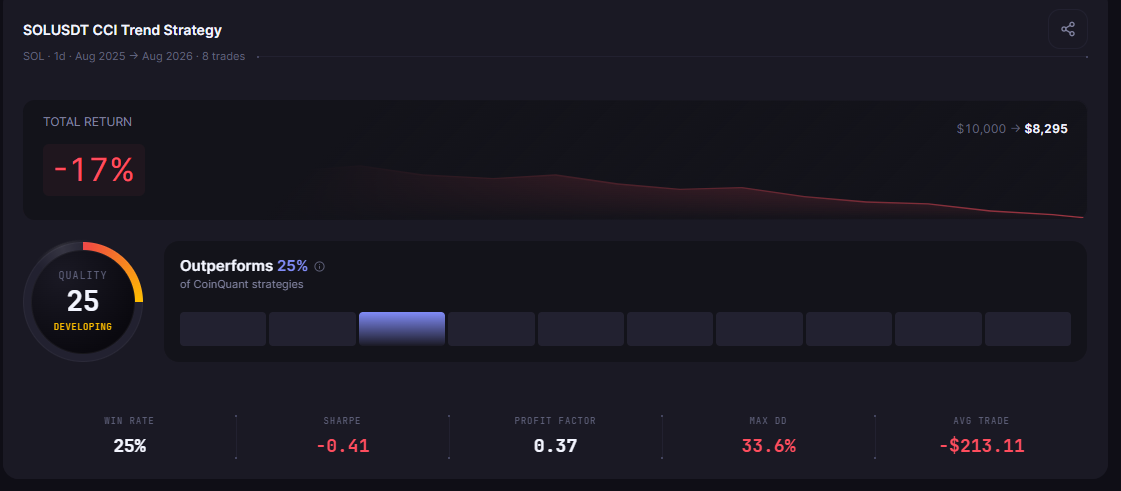
The daily strategy, "SOL CCI(20) Range Oscillator 1D," produced eight trades over the 12-month period. Two of those eight were winners, giving a win rate of 25.0% and a total return of -17.0%. The maximum drawdown reached 33.6%, the Sharpe Ratio was -0.41, and the Profit Factor was 0.37.
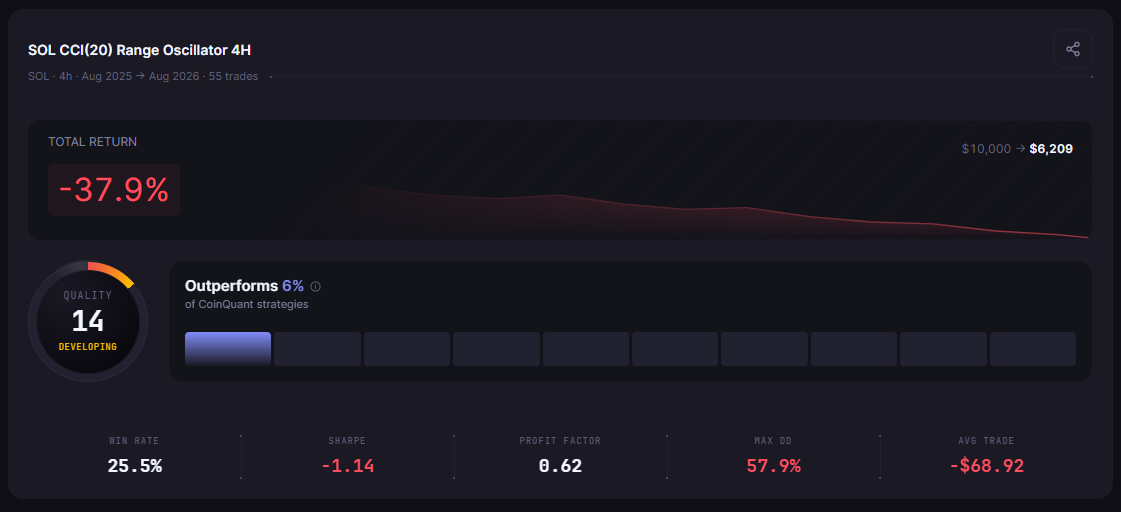
The four-hour strategy, "SOL CCI(20) Range Oscillator 4H," generated 55 trades, a much larger sample across the same window. The win rate held at 25.5%, barely distinguishable from the daily result, but the total return dropped to -37.9% and the maximum drawdown widened significantly to 57.9%. The Sharpe Ratio was -1.14 and the Profit Factor was 0.62.
| Strategy | Total Return | Total Trades | Win Rate | Max Drawdown | Sharpe Ratio | Profit Factor |
|---|---|---|---|---|---|---|
| SOL CCI(20) Range Oscillator 1D | -17.0% | 8 | 25.0% | 33.6% | -0.41 | 0.37 |
| SOL CCI(20) Range Oscillator 4H | -37.9% | 55 | 25.5% | 57.9% | -1.14 | 0.62 |
The win rate is nearly identical across both timeframes at roughly 25%, which means the signal quality did not improve on the four-hour chart. The higher trade count simply provided more opportunities to absorb losses in a market where three in four signals did not work.
Cross-Asset Comparison: SOL vs BTC CCI Results
CoinQuant comparison view showing the BTC and SOL CCI strategies side by side, making it easy to compare each strategy's rules before reviewing the backtest results.
| Strategy | Asset | Total Return | Total Trades | Win Rate | Max Drawdown |
|---|---|---|---|---|---|
| BTC CCI(20) Trend Momentum 1D | BTC | -16.1% | 9 | 11.1% | 25.9% |
| SOL CCI(20) Range Oscillator 1D | SOL | -17.0% | 8 | 25.0% | 33.6% |
| BTC CCI(20) Trend Momentum 4H | BTC | -25.2% | 59 | 32.2% | 28.7% |
| SOL CCI(20) Range Oscillator 4H | SOL | -37.9% | 55 | 25.5% | 57.9% |
On the daily timeframe, the total returns are close: -16.1% for BTC vs -17.0% for SOL. The similar loss levels with similar trade counts suggest the CCI(20) signal fired in broadly similar conditions on both assets. The difference is in maximum drawdown: SOL reached 33.6% vs BTC's 25.9%, a 7.7 percentage point increase that reflects Solana's larger per-trade price swings.
On the four-hour timeframe, the divergence is more pronounced. BTC lost -25.2% across 59 trades; SOL lost -37.9% across 55 trades. The max drawdown gap is even larger: 57.9% for SOL vs 28.7% for BTC. With roughly similar trade counts, the Solana strategy's losses were deeper per trade because SOL's price moves more aggressively in both directions.
What SOL's Volatility Does to CCI Signals
The cross-asset comparison answers the article's core question directly: SOL's higher volatility did not rescue the CCI signal. It deepened the losses.
CCI above +100 on Solana means the price is trading unusually far above its 20-period average. On a high-volatility asset like SOL, price reaches those extreme readings more readily than on Bitcoin, which historically trades with more dampened short-term oscillations. More frequent extreme readings mean more CCI entries, but entering a volatile asset on a signal generated by its own volatility is circular logic. The entries do not carry more information; they reflect the asset's nature.
The four-hour result shows this most clearly. SOL's 57.9% maximum drawdown on the four-hour chart was more than double the BTC four-hour equivalent (28.7%). This is the cost of applying a trend-following momentum signal to a high-volatility asset in a range market. When the signal is wrong, SOL moves further against the position before the CCI exit trigger is reached.
The daily timeframe reduced the damage by generating fewer entries: eight trades versus 55. Fewer entries in a losing setup means fewer losses, which is why the daily result at -17.0% was dramatically better than the four-hour result at -37.9%. The same pattern held for BTC CCI, confirming it as a consistent effect of timeframe choice rather than an asset-specific anomaly.
The Practical Lesson
The SOL CCI(20) backtest provides a clean answer to the volatility question: higher volatility does not improve a failing momentum signal. It magnifies the losses when the signal is wrong and expands the drawdown when conditions are not trending.
Both the daily and four-hour Solana CCI results were negative for the 12-month test window, consistent with the Bitcoin CCI findings in Article 166. The signal logic is the same; the asset is different; the outcome is similarly negative in the same market conditions.
The key differences between the SOL and BTC results:
SOL's daily win rate was higher (25.0% vs 11.1%), suggesting the CCI signal was modestly more accurate on Solana, but losses per trade were larger enough to produce similar total loss.
SOL's four-hour max drawdown (57.9%) was dramatically higher than BTC's (28.7%), confirming that volatility amplifies the drawdown risk when the signal is wrong.
Trade counts were similar across assets at each timeframe, suggesting the CCI(20) threshold fires at comparable frequencies on both.
A trader considering CCI momentum strategies on Solana should account for the asset's volatility explicitly, either by reducing position size relative to a BTC setup with the same signal, or by requiring additional confirmation before entering. The backtest data from both assets supports using the daily timeframe over four-hour if CCI entries are being tested.
Disclaimer:
Key Takeaway
