
CCI Strategy on Bitcoin: What 12 Months of Backtest Data Reveals
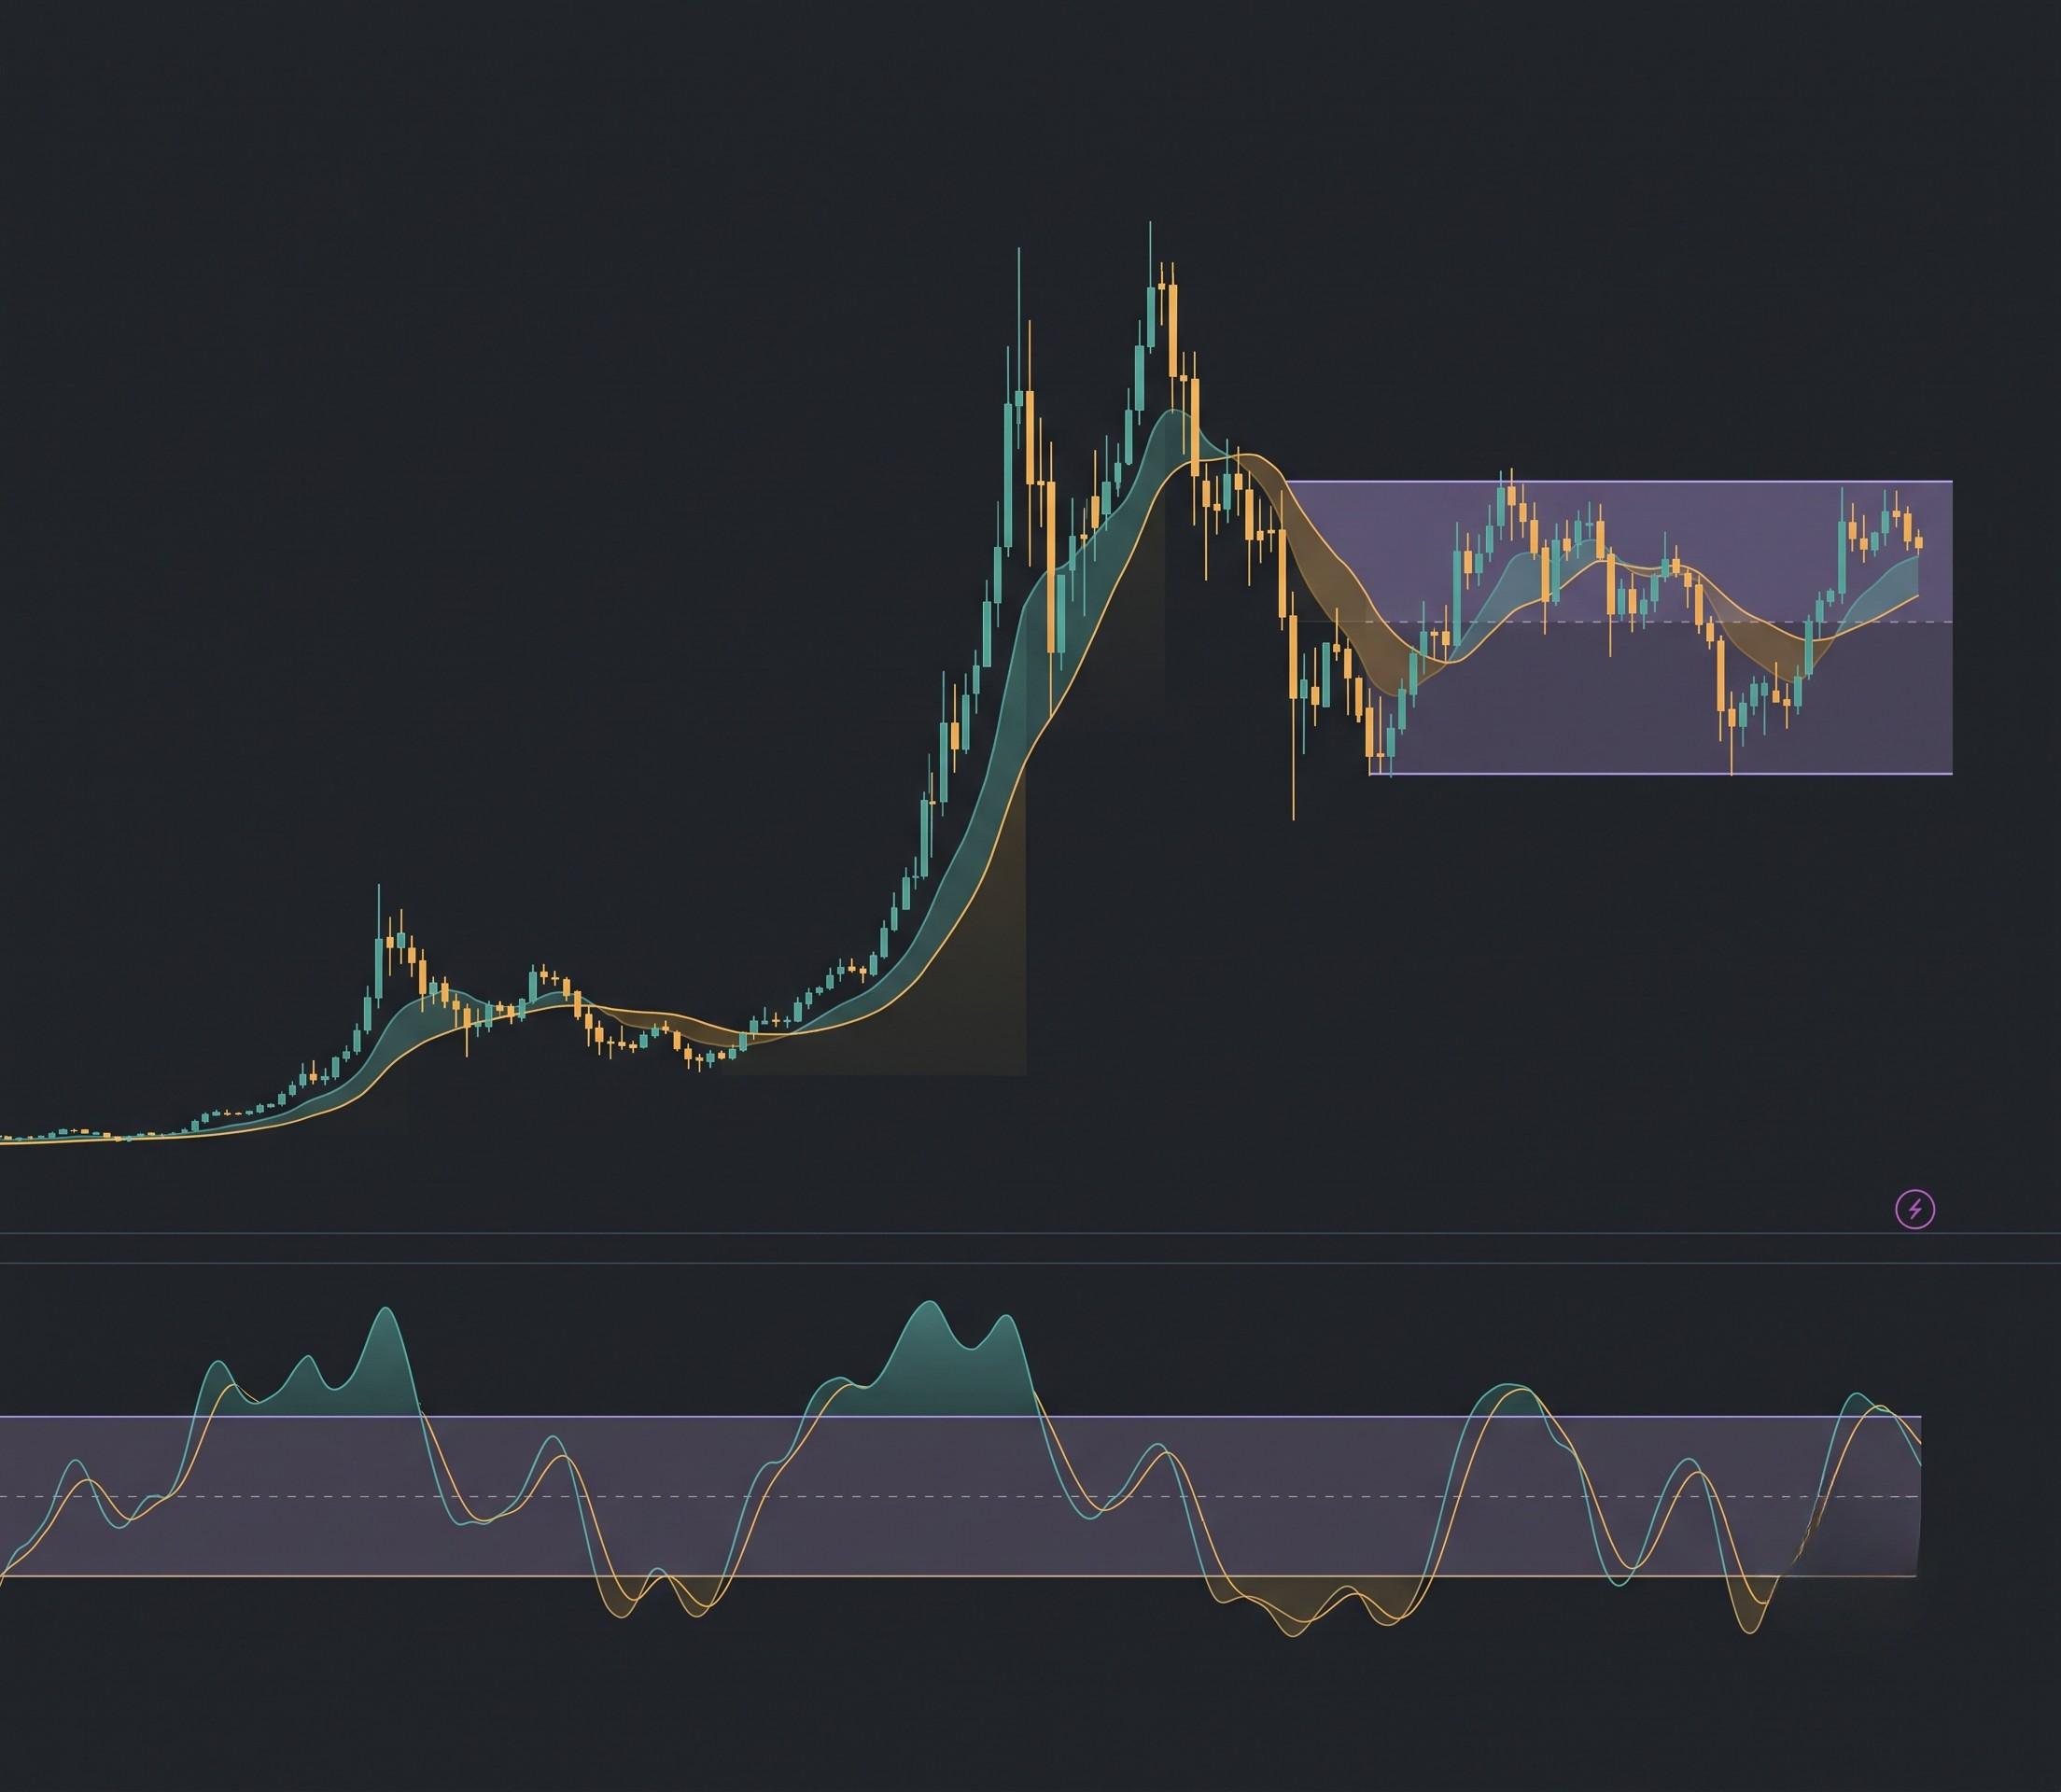
Bitcoin traders have argued about the Commodity Channel Index for years. The case for using it is intuitive: CCI rises above +100 when price is demonstrating genuine upward momentum above its recent range, giving a rules-based entry with a clear trigger. The case against is equally intuitive: in a range-bound market, that +100 threshold gets crossed repeatedly on moves that reverse almost immediately.
This article stops the argument with data. A CCI(20) trend momentum strategy was backtested on Bitcoin across daily and four-hour timeframes on CoinQuant, and three variants of the entry and exit rules were tested to see whether any adjustment changes the outcome. CoinQuant backtests include fees and slippage, so the returns shown here reflect real trading costs, not idealized conditions.
The numbers are reported exactly as they came from the platform.
What the CCI(20) Trend Momentum Strategy Does
The Commodity Channel Index measures the difference between the current typical price and a simple moving average of price, scaled by a factor of the mean absolute deviation. The practical result is an oscillator where readings above +100 indicate that price is trading unusually far above its average, suggesting strong bullish pressure, and readings below -100 indicate the opposite.
The strategy tested here uses the two most common CCI interpretation rules:
Entry: Long when CCI(20) crosses above +100
Exit: Long when CCI(20) crosses back below 0
The logic is to enter when Bitcoin shows genuine upward momentum and exit when that momentum returns to neutral. Long-only, no leverage, no additional filters layered on top of the CCI signal. Two variants were also tested during iteration: one changing the entry and exit thresholds and one adding hard risk controls.
Test Setup
| Parameter | Value |
|---|---|
| Asset | BTCUSDT (Binance Spot) |
| Indicator | CCI, 20-period |
| Timeframes Tested | Daily (1D), Four-Hour (4H) |
| Test Window | August 3, 2025 to August 3, 2026 |
| Fees and Slippage | Included |
| Data Source | Kaiko via CoinQuant |
Baseline Results: Daily vs Four-Hour
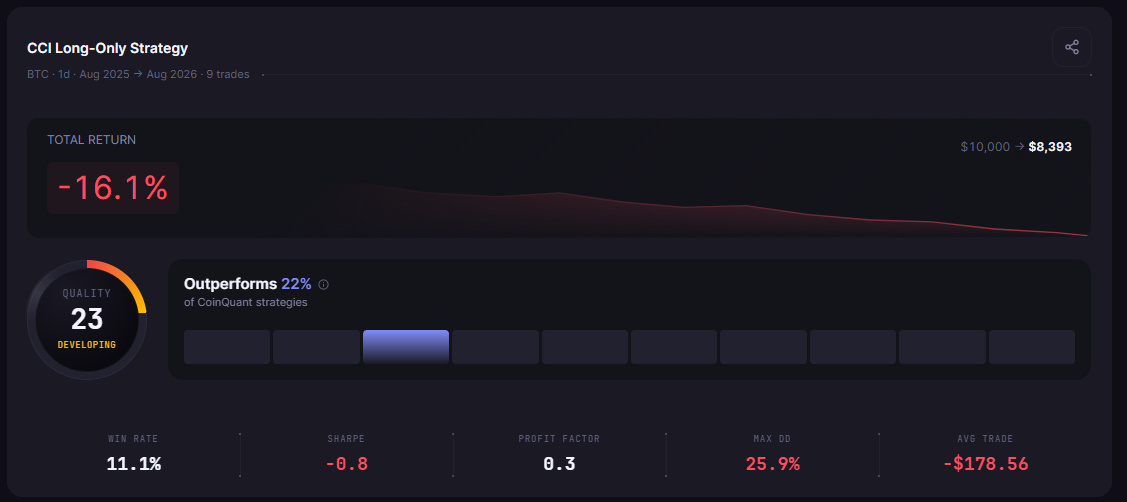
The daily strategy produced nine trades over the 12-month period. Only one of those nine ended as a winner. The win rate of 11.1% and total return of -16.1% confirm that the CCI(20) momentum signal was firing into conditions where Bitcoin reversed rather than continued.
The four-hour timeframe produced a much higher trade count but not a better result. "BTC CCI(20) Trend Momentum 4H" generated 59 trades over the same window, with a win rate of 32.2% and a total return of -25.2%. The four-hour chart produced more crossings above +100, and most of those crossings were false positives. The maximum drawdown reached 28.7%, deeper than the daily strategy.
| Strategy | Total Return | Total Trades | Win Rate | Max Drawdown | Sharpe Ratio | Profit Factor |
|---|---|---|---|---|---|---|
| BTC CCI(20) Trend Momentum 1D | -16.1% | 9 | 11.1% | 25.9% | -0.80 | 0.30 |
| BTC CCI(20) Trend Momentum 4H | -25.2% | 59 | 32.2% | 28.7% | -1.28 | 0.58 |
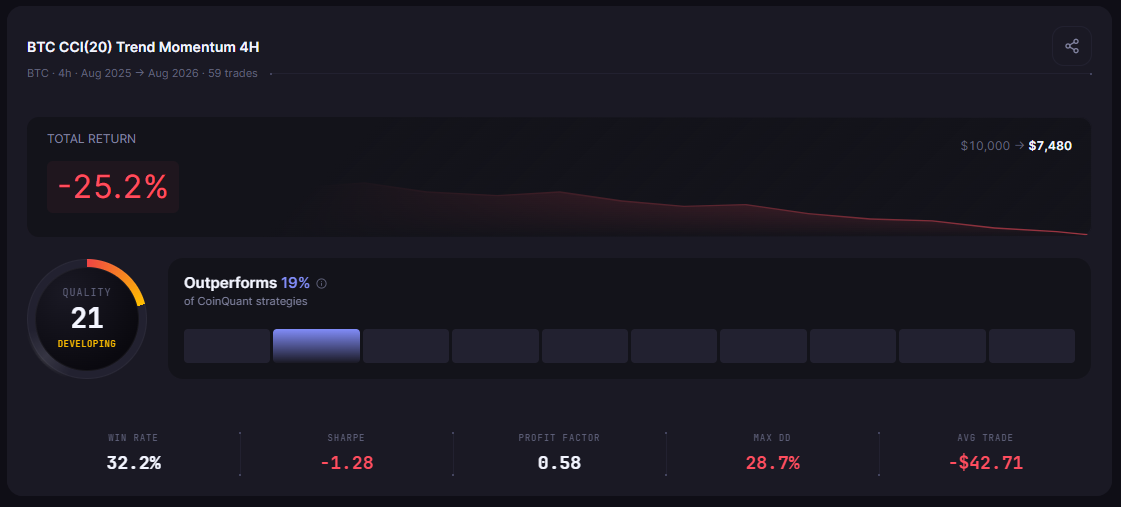
More signals on the four-hour chart translated directly into more losing trades. The signature of a momentum strategy misfiring in a range market is exactly this pattern: high signal frequency, low win rate, steady loss accumulation across dozens of trades.
Tuning the Signal: Three Variants Tested
With both baseline strategies finishing negative, iteration focused on whether adjusting the entry and exit thresholds, or adding risk controls, could recover the strategy.
v3: Enter Earlier, Exit Later
The first variant lowers the entry threshold from +100 to zero, entering when CCI(20) crosses above zero rather than waiting for the stronger +100 reading. The exit is moved from zero to -100, requiring a deeper reversal before closing the trade. The hypothesis was that catching the momentum move earlier might capture more of the upswing before the signal reaches +100.
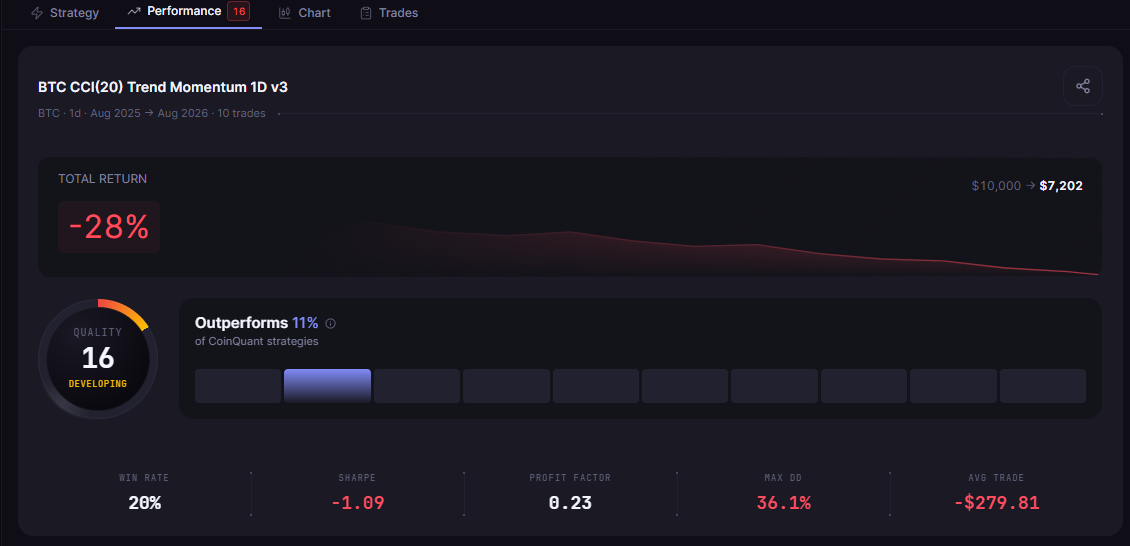
The result of "BTC CCI(20) Trend Momentum 1D v3 (enter 0 exit -100)" was -28.0% on 10 trades with a win rate of 20.0% and a maximum drawdown of 36.1%. Entering earlier meant entering on weaker signals in a market that was already prone to reversals. Both the total loss and the maximum drawdown worsened materially compared to the baseline.
v4: Original Entry With Hard Risk Controls (Recommended)
The recommended variant keeps the original entry threshold at +100 but adds explicit position-level risk management: exit the trade when profit reaches 10% or when loss exceeds 5%, in addition to the CCI(20) crossing back below zero.
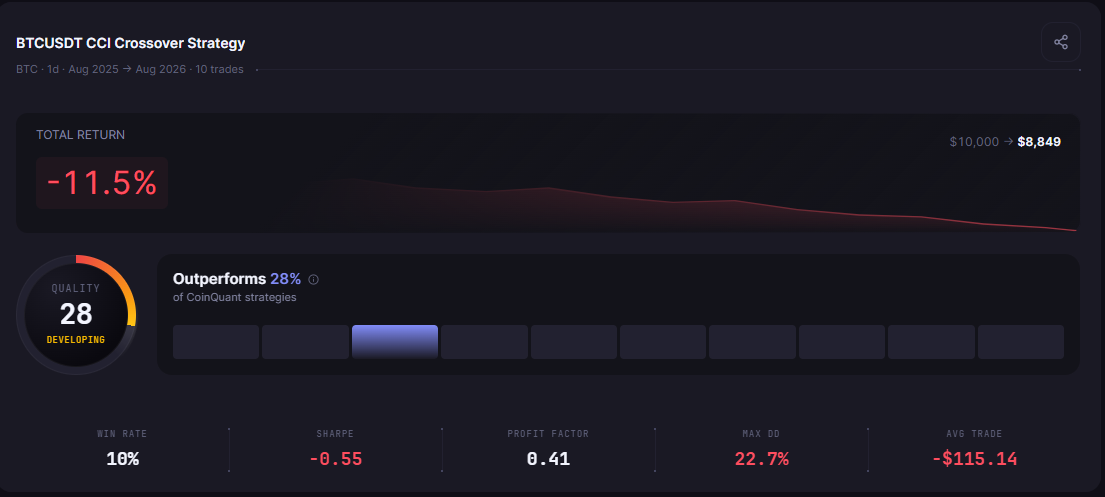
"BTC CCI(20) Trend Momentum 1D v4 (TP10 SL5)" produced a total return of -11.5% on 10 trades, with the maximum drawdown cut to 22.7%.
| Strategy | Total Return | Total Trades | Win Rate | Max Drawdown | Sharpe Ratio | Profit Factor |
|---|---|---|---|---|---|---|
| BTC CCI(20) Trend Momentum 1D | -16.1% | 9 | 11.1% | 25.9% | -0.80 | 0.30 |
| BTC CCI(20) Trend Momentum 1D v3 (enter 0 exit -100) | -28.0% | 10 | 20.0% | 36.1% | -1.09 | 0.23 |
| BTC CCI(20) Trend Momentum 1D v4 (TP10 SL5) | -11.5% | 10 | 10.0% | 22.7% | -0.55 | 0.41 |
The risk controls improved the total return by 4.6 percentage points and reduced the maximum drawdown by 3.2 percentage points compared to the baseline. The win rate fell to 10.0%, which tells the story plainly: the 5% stop-loss triggered more frequently than the 10% take-profit. The stops were doing their job by capping the damage on trades that would otherwise have run further into loss.
What the Iteration Reveals
The four tests together tell a coherent story.
Lowering the entry threshold in v3 made the strategy worse because it exposed the capital to weaker, noisier signals. Raising the bar for entry (as the original +100 setting does) is already a filtering mechanism, and removing it by entering at zero removed that filter without providing anything in return.
Adding hard risk controls in v4 narrowed the loss and reduced drawdown without changing the direction of the result. This is the honest takeaway from the iteration: risk controls matter and they measurably reduce damage, but they cannot manufacture a positive edge from a signal that is not firing.
The underlying reason the CCI(20) momentum signal underperformed comes down to market regime. The August 2025 to August 2026 window included sustained range-bound and consolidating price action for Bitcoin. CCI is a momentum oscillator built to capture sustained directional moves. When Bitcoin spends months consolidating rather than trending, the +100 crossings that CCI generates are short-lived, followed quickly by reversals back through the exit level.
The four-hour chart amplified the problem by generating 59 signals in the same environment where the daily chart generated only nine. More opportunities in a choppy market means more losing entries, not more profitable ones.
The Practical Lesson
The CCI(20) trend momentum strategy on Bitcoin returned negative results across every configuration tested during this 12-month window. That is the data, reported without adjustment.
The value of running this backtest is knowing this before risking capital, not after. A trader who believed in CCI momentum because of its historical reputation would have lost money following these signals during the past 12 months.
Two specific lessons emerge from the iteration:
Risk controls reduce damage in losing conditions. The v4 result at -11.5% and 22.7% drawdown is measurably better than the baseline, even when the outcome is still negative.
Adjusting entry thresholds without improving signal quality adds noise. v3 demonstrated this by turning a -16.1% loss into a -28.0% loss.
The next logical step is to extend the test window to include the 2024 bull market and early 2025 trend conditions. Whether the strategy redeems itself across a full cycle is the question worth answering before writing it off entirely.
Disclaimer:
Key Takeaway
