
Bull Market Crypto Strategy: What Backtested Best in the 2021 Rally (and Why It Matters Now)
Every bull market produces the same question: which strategy would have caught this? The 2021 Bitcoin rally was the cleanest test available, a parabolic run from roughly $29,000 in January to $69,000 in November, and it is now fully inside historical data.
This article runs the BTC Trend Following 1D 2021-2026 strategy from the CoinQuant strategy library on daily Bitcoin data from January 2021 to August 2026 and breaks the results down year by year, with the 2021 bull leg examined separately.
The finding is not what most traders expect. The strategy that backtested best over the full cycle lost money in the 2021 rally itself, and the bull market crypto trading strategy that actually worked in 2021 was a different family entirely.
What the Trend Following Strategy Does
The strategy is about as simple as systematic trading gets:
Entry: close crosses above the 200-day simple moving average (SMA 200)
Exit: close crosses below the SMA 200
Position size: 100% of equity, long only, no leverage
The 200-day average is the classic long-term trend filter. Above it, the market is in a sustained uptrend and the strategy is long. Below it, the strategy sits in cash. It trades rarely, holds for months, and its entire edge depends on capturing big sustained moves.
Test Setup
| Parameter | Setting |
|---|---|
| Strategy (library name) | BTC Trend Following 1D 2021-2026 |
| Instrument | BTCUSDT (spot, Binance) |
| Timeframe | Daily (1D) |
| Tested window | 2021-01-01 to 2026-08-01 (5.6 years) |
| Rules | Close crosses above SMA(200) to enter, below SMA(200) to exit |
| Direction | Long only, no leverage |
| Initial capital | $10,000 |
| Position size | 100% of equity per entry |
| Fees | 0.1% taker, modeled on every trade |
| Data source | Kaiko via CoinQuant |
The Full-Window Result
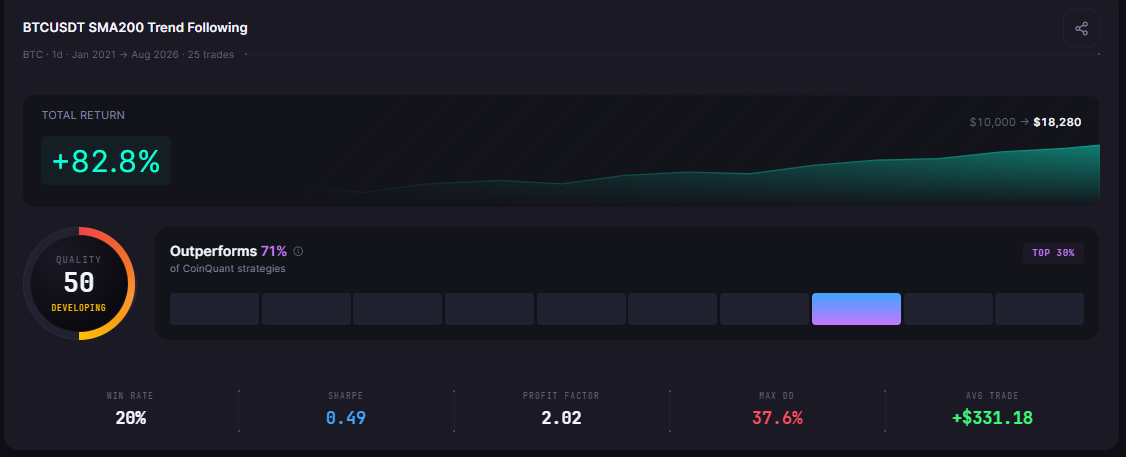
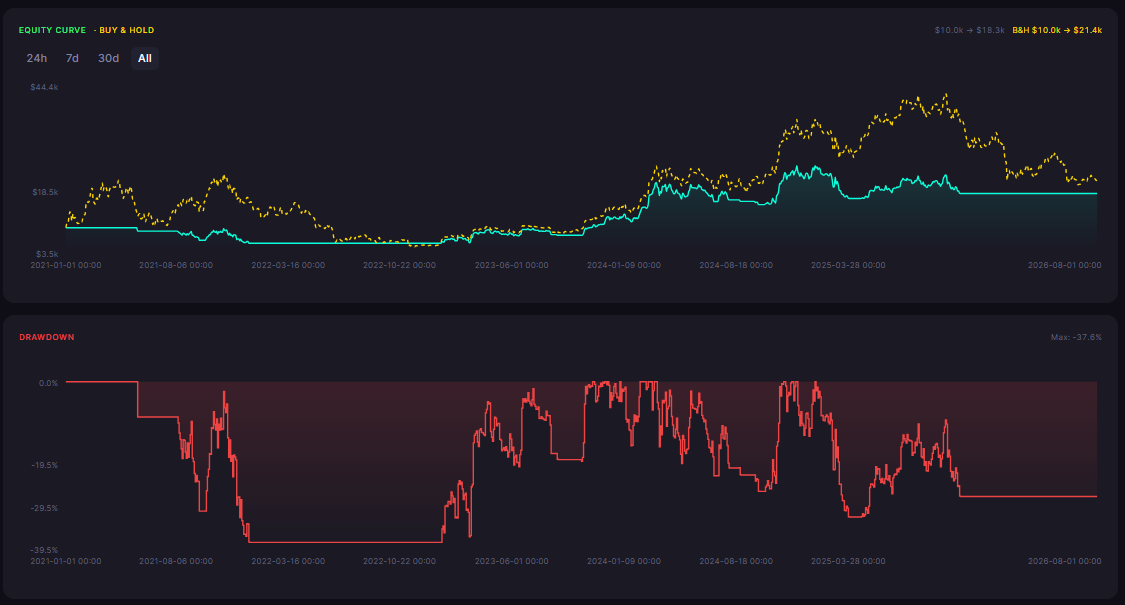
Over the full 5.6 years, the strategy turned $10,000 into $18,279.53, a total return of +82.80% across 25 trades. The profit factor of 2.02 and the Sharpe ratio of 0.49 are solid for a strategy that was in the market less than half the time.
| Metric | Result |
|---|---|
| Total Return | +82.80% ($10,000 → $18,279.53) |
| CAGR | 11.41% |
| Total Trades | 25 |
| Win Rate | 20.0% (5W / 20L) |
| Profit Factor | 2.02 |
| Sharpe Ratio | 0.49 |
| Sortino Ratio | 0.73 |
| Max Drawdown | 37.63% |
| Average Win | $3,275.79 |
| Average Loss | $404.97 |
| Best Trade | +$8,165.28 |
| Worst Trade | -$825.96 |
| Time in Market | 47.77% |
| Total Fees | $654.79 |
Year by Year: Where the Return Actually Came From
The trades CSV export of the verified backtest lets us split the results by calendar year. This is the part of the data that changes the story.
| Year | Trades | Net P&L | What happened |
|---|---|---|---|
| 2021 | 9 | -$3,762.79 | Late entries into a topping market, all nine trades lost |
| 2022 | 0 | $0.00 | Below SMA 200 all year, strategy sat in cash |
| 2023 | 2 | +$1,938.72 | First sustained re-entry of the new cycle |
| 2024 | 5 | +$7,395.28 | The breakout year, best single trade +$8,165.28 |
| 2025 | 9 | +$2,708.32 | Late-cycle chop, small net gains |
| 2026 YTD | 0 | $0.00 | Below the 200-day average through July |
The strategy made 89% of its profit in 2024. It contributed nothing in 2022, and it actively lost money in the 2021 bull market.
Why the 2021 Rally Was a Loss for This Strategy
The 200-day filter is slow by design, and the 2021 rally punished slowness. Price crossed above the SMA 200 in early 2021, but the strategy's first closed trades in the window start in May 2021, after the April peak near $64,000. From May to December, Bitcoin chopped between $30,000 and $69,000 with repeated sharp drawdowns, and the SMA 200 cross kept flipping the position into a deteriorating market.
All nine trades closed in 2021 were losers, with a combined net loss of $3,762.79. The largest loss was $825.96, so the damage was not one disaster, it was a steady bleed of small losses, which is the signature of a trend filter fighting a topping range.
The lesson for a bull market crypto trading strategy is uncomfortable: the slowest trend strategy missed most of the 2021 rally and lost money in the part it did trade. The bull market was real, and this strategy was on the wrong side of its final act.
What Did Work in the 2021 Rally
To answer the title question fairly, here is how the other tested library strategies on BTCUSDT 1D performed in the same 2021 calendar year, from their verified backtests:
| Strategy (library name) | 2021 net P&L | 2021 trades |
|---|---|---|
| BTC Breakout 1D 2021-2026 | +$8,785.90 | 3 |
| BTC OBV(20) Trend 1D | +$3,487.97 | 6 |
| BTC Bollinger Mean Reversion 1D 2021-2026 | +$1,903.31 | 6 |
| BTC EMA Crossover 20/50 1D 2021-2026 | +$1,261.28 | 2 |
| BTC Mean Reversion 1D 2021-2026 | -$1,057.15 | 1 |
| BTC Trend Following 1D 2021-2026 | -$3,762.79 | 9 |
The breakout family won the 2021 bull leg. The Donchian 20 breakout strategy captured $8,786 in three trades, because breakout entries are fast and the 2021 rally was full of fresh highs. The volume-confirmed OBV trend filter also profited. The slow trend follower and the mean reversion rules lost, for opposite reasons: one was too slow, the other was too early.
Why It Matters Now
This is not history trivia. The same cycle-positioning question is live in August 2026, with SOL ETF inflows reported up sharply, infrastructure-era coverage rising, and Bitcoin still roughly 55% below its all-time high.
A trader asking "which bull market crypto strategy should I hold now" gets a data-backed answer instead of a guess: in the last confirmed bull leg, fast breakout rules captured the move and slow 200-day filters missed it. The trend follower only became profitable in the year after the peak, when the market had already made its lows.
The practical implication is that strategy choice is regime choice. If the next bull leg arrives, the library data says breakout and volume-confirmed trend rules are the families that monetized the 2021 version of it.
The Practical Lesson
The full-cycle winner was not the 2021 winner. BTC Trend Following 1D earned +82.80% over 5.6 years while losing money in the 2021 rally
2021 belonged to breakout rules. The Donchian 20 breakout earned +$8,786 in three trades, the best 2021 result in the tested set
Year-by-year analysis changes the verdict. Aggregate metrics hid the fact that 89% of the trend follower's profit came from a single year
The next bull market question is a strategy family question. Test the breakout and trend families on your own parameters before the rally, not during it
Run this bull-market comparison yourself and test your own variations on CoinQuant. Backtest bull-market strategies free on CoinQuant
Disclaimer:
Key Takeaway