
Breakout vs Mean Reversion on Ethereum: Which Strategy Backtested Better 2021-2026?

Every strategy family makes a bet about how markets behave. Breakout strategies bet that moves continue: when price clears a range high, they buy the break. Mean reversion strategies bet the opposite: when price gets stretched, they buy the snap-back. Both can be right, in different markets. The question for Ethereum is which one was right in its own data.
This article answers that question with a head-to-head: the Donchian breakout strategy versus the RSI mean reversion strategy, both on daily Ethereum, both over the same five-year window from August 2021 to August 2026. Same asset, same timeframe, same fees. Very different philosophies, and the results are not close.
The Two Strategies
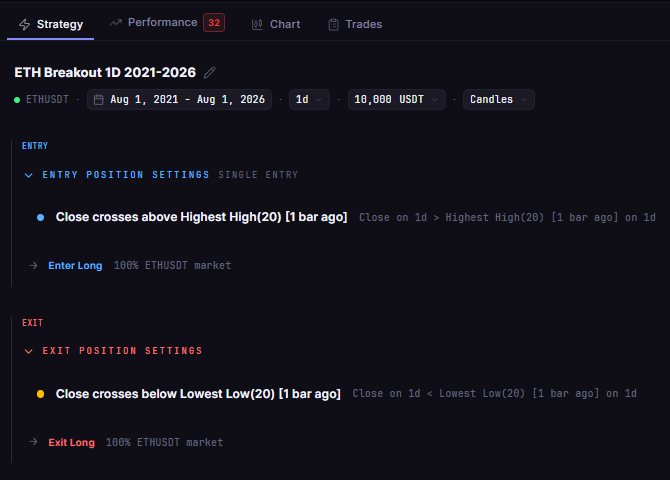
ETH Breakout 1D 2021-2026
The breakout strategy is built on the Donchian channel, the classic trading-range tracker:
Entry: close crosses above the highest high of the prior 20 daily bars
Exit: close crosses below the lowest low of the prior 20 daily bars
The logic is pure trend following: Ethereum is bought only when it clears a 20-day range high, and the position is held until price breaks down through the 20-day range low. It is designed to ride sustained moves and sit out chop.
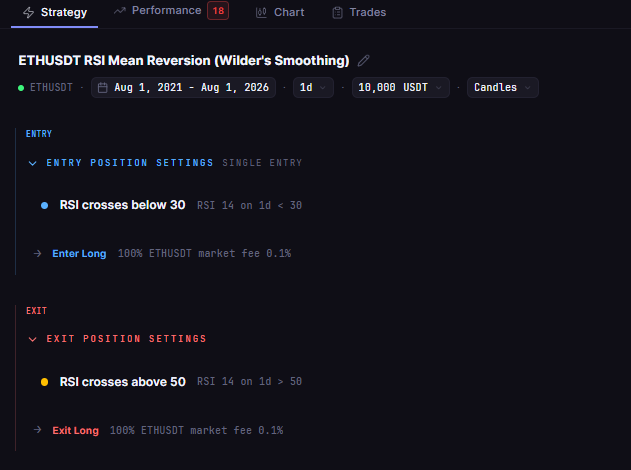
ETH RSI(14) Mean Reversion 1d
The mean reversion strategy is built on the Relative Strength Index:
Entry: RSI(14) crosses below 30, the oversold threshold
Exit: RSI(14) crosses back above 50
The logic is the opposite bet: sharp daily selloffs on Ethereum tend to snap back, so the strategy buys weakness and sells the recovery. It is long only, one position at a time, 100% of equity per entry in both strategies.
Test Setup
| Parameter | Breakout | Mean Reversion |
|---|---|---|
| Strategy (library names) | ETH Breakout 1D 2021-2026 | ETH RSI(14) Mean Reversion 1d |
| Instrument | ETHUSDT (spot, Binance) | ETHUSDT (spot, Binance) |
| Timeframe | Daily (1D) | Daily (1D) |
| Tested window | 2021-08-01 to 2026-08-01 | 2021-08-01 to 2026-08-01 |
| Entry | Close above 20-day high | RSI(14) crosses below 30 |
| Exit | Close below 20-day low | RSI(14) crosses above 50 |
| Direction | Long only, no leverage | Long only, no leverage |
| Initial capital | $10,000 | $10,000 |
| Position size | 100% of equity per entry | 100% of equity per entry |
| Fees | 0.1% taker, modeled | 0.1% taker, modeled |
| Data source | Kaiko via CoinQuant | Kaiko via CoinQuant |
The Backtest Results
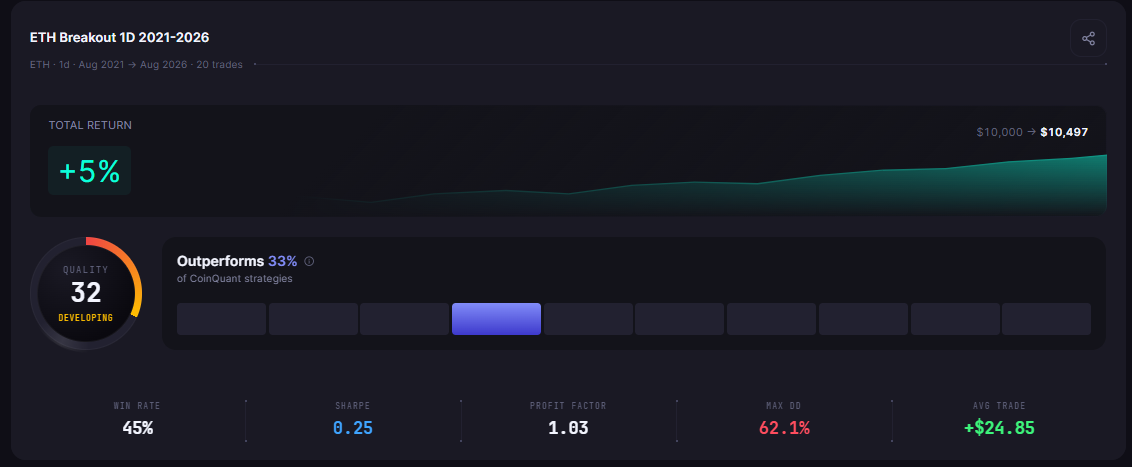
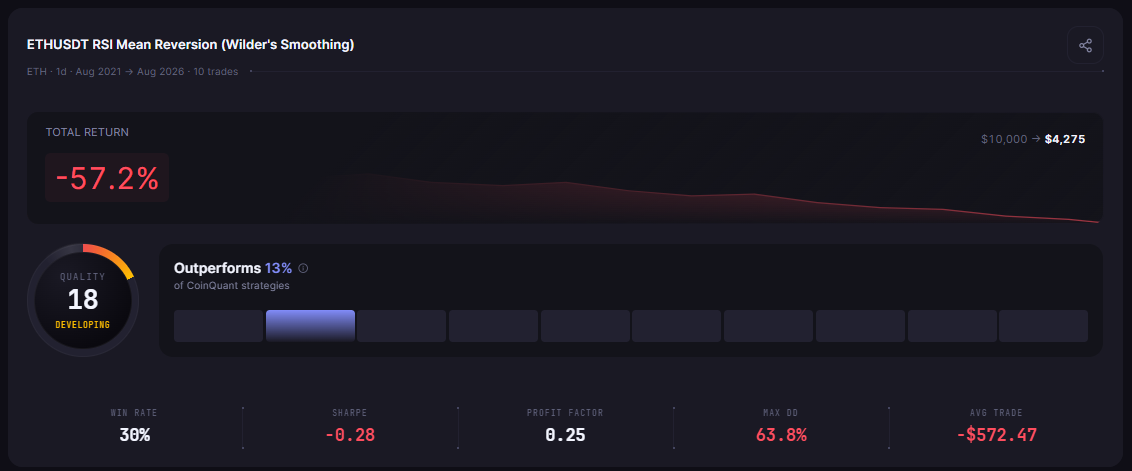
The head-to-head is decisive. The breakout strategy finished the five years with a small profit. The mean reversion strategy lost more than half the account.
| Metric | Breakout (Donchian 20) | Mean Reversion (RSI 30/50) |
|---|---|---|
| Total Return | +4.98% | -57.20% |
| Final Balance | $10,497.79 | $4,280.17 |
| Total Trades | 20 | 10 |
| Win Rate | 45.0% (9W / 11L) | 30.0% (3W / 7L) |
| Profit Factor | 1.03 | 0.25 |
| Sharpe Ratio | 0.25 | -0.28 |
| Sortino Ratio | 0.37 | -0.39 |
| Max Drawdown | 62.10% | 63.71% |
| Average Win | $2,020.32 | $624.59 |
| Average Loss | $1,607.73 | $1,084.80 |
| Best Trade | +$5,808.61 | +$883.57 |
| Worst Trade | -$3,940.77 | -$4,190.14 |
| Time in Market | 48.88% | 18.28% |
| Total Fees | $81.37 | $124.81 |
What the Data Shows
The mean reversion strategy was not just beaten, it was structurally wrong for Ethereum in this window. Its win rate was 30%, its average win of $624.59 was barely more than half its average loss of $1,084.80, and its profit factor of 0.25 means it produced 25 cents of profit for every dollar lost. With a payoff like that, no win rate could save it.
The breakout strategy was barely profitable, +4.98% over five years, but it at least showed the shape of a working system. It caught a handful of large Ethereum moves, the best a +$5,808.61 win, and its average win of $2,020.32 outweighed its average loss of $1,607.73. A profit factor of 1.03 is a razor-thin edge, and the 62.10% max drawdown shows the ride was brutal, but the direction of the bet was right.
Why Mean Reversion Failed on Ethereum
The failure is diagnostic. Ethereum's daily moves in the 2021-2026 window were deep and slow to recover. When daily RSI crossed below 30, the asset kept falling or stagnated for long stretches, and the oversold entry kept catching falling knives. The 2022 bear market delivered exactly the wrong environment: sustained declines that only occasionally snapped back, and never for long.
The strategy's time in market tells the story: 18.28%. It was flat more than four days out of five, waiting for oversold setups that mostly did not pay. When it did trade, it lost more on losers than it made on winners, the structural signature of a strategy fighting the asset.
Why Breakout Held Up
The breakout strategy spent 48.88% of the time in the market and captured the sustained Ethereum moves that actually happened: the late-2021 rally leg, the 2023-2024 recovery, and the 2024-2025 advance. Its 45% win rate with a 1.26 payoff ratio is the classic trend-following profile, win less often, win bigger.
It did not come cheap. The 62.10% max drawdown means the strategy was more than 60% underwater at its worst point, and a trader would have needed to sit through it. A profit factor of 1.03 is also uncomfortably close to a coin flip. This is not a ringing endorsement of breakout trading on Ethereum. It is evidence that in this window, the momentum bet was the only one of the two that worked at all.
The Practical Lesson
Strategy family selection matters more than settings: the same asset, timeframe, and fee model produced +4.98% and -57.20%
Ethereum's 2021-2026 daily profile rewarded trend continuation and punished oversold snap-backs
The breakout's thin edge (profit factor 1.03) and 62% drawdown are honest warnings, not endorsements
One head-to-head is not a verdict for all time: regimes change, and both families should be retested when the market character shifts
The breakout versus mean reversion question has a data-backed answer for Ethereum 2021-2026: the momentum bet survived, the snap-back bet did not. The next step is not to accept these numbers as final, it is to test variations: breakout with a shorter channel, mean reversion with a different threshold, or a regime filter that switches families. Each change needs its own backtest before it earns a place in a live strategy.
Run these two Ethereum strategies yourself and test your own variations on CoinQuant. Run this breakout vs mean reversion backtest free on CoinQuant
Disclaimer:
Key Takeaway