
Bollinger Mean Reversion vs RSI Mean Reversion on Bitcoin: Which Mean-Reverts Better? (1D, 2021-2026)
Mean reversion has two famous implementations. The Bollinger version buys when price touches the lower band, betting the move has gone too far from the average. The RSI version buys when the oscillator crosses below 30, betting the momentum of the selloff is exhausted. Both are sold as the same idea, oversold bounces, but they measure "oversold" differently and they do not produce the same results.
This article runs both on daily Bitcoin over the same five-year window, August 2021 to August 2026, with identical position sizing and fees. Two implementations of the same family, one clear winner, and the difference is instructive.
The Two Strategies
BTC Bollinger Mean Reversion 1D 2021-2026
The Bollinger implementation uses the classic band setup:
Entry: close crosses below the lower Bollinger band (20, 2.0)
Exit: close crosses back above the middle band (the 20-period SMA)
The logic is statistical: price stretched more than two standard deviations below its 20-day average is considered stretched, and the strategy buys the snap-back to the mean.
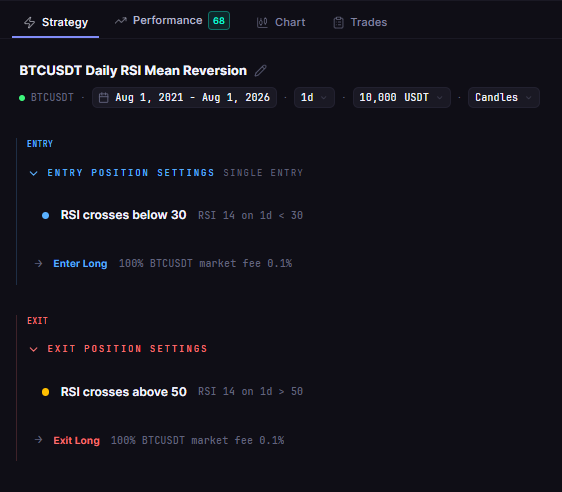
BTC RSI(14) Mean Reversion 1d
The RSI implementation uses the oscillator threshold:
Entry: RSI(14) crosses below 30, the oversold threshold
Exit: RSI(14) crosses back above 50
The logic is momentum-based: when daily RSI drops below 30, selling pressure is considered exhausted, and the strategy buys the recovery.
Both are long only, one position at a time, 100% of equity per entry, 0.1% taker fee modeled.
Test Setup
| Parameter | Bollinger Mean Reversion | RSI Mean Reversion |
|---|---|---|
| Strategy (library names) | BTC Bollinger Mean Reversion 1D 2021-2026 | BTC RSI(14) Mean Reversion 1d |
| Instrument | BTCUSDT (spot, Binance) | BTCUSDT (spot, Binance) |
| Timeframe | Daily (1D) | Daily (1D) |
| Tested window | 2021-08-01 to 2026-08-01 | 2021-08-01 to 2026-08-01 |
| Entry | Close below lower Bollinger (20, 2.0) | RSI(14) crosses below 30 |
| Exit | Close above middle band | RSI(14) crosses above 50 |
| Direction | Long only, no leverage | Long only, no leverage |
| Initial capital | $10,000 | $10,000 |
| Position size | 100% of equity per entry | 100% of equity per entry |
| Fees | 0.1% taker, modeled | 0.1% taker, modeled |
| Data source | Kaiko via CoinQuant | Kaiko via CoinQuant |

The Backtest Results
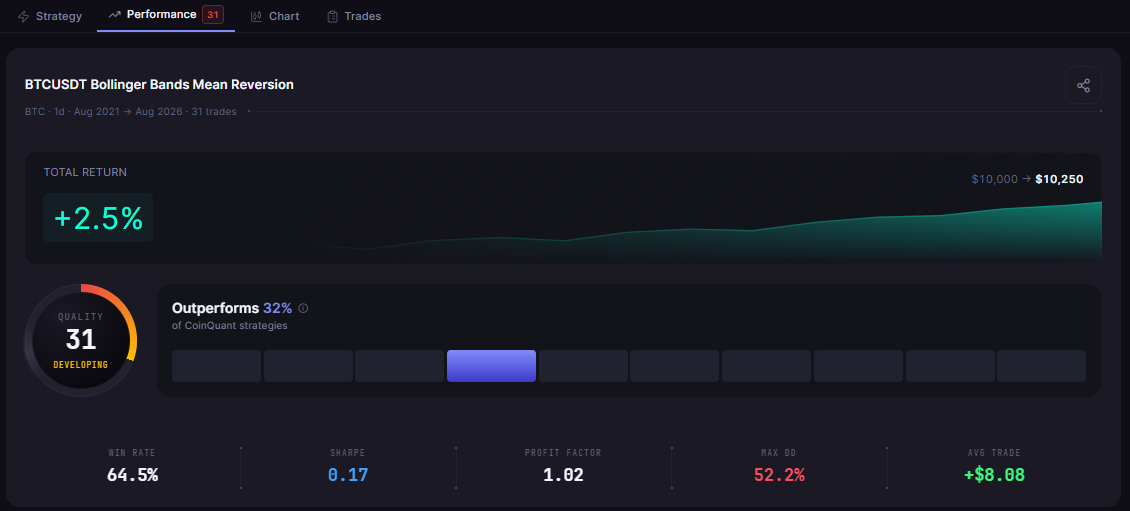
The two implementations could hardly be further apart. The RSI version turned $10,000 into $15,569.27. The Bollinger version turned $10,000 into $10,250.60, a return barely above zero.
| Metric | Bollinger MR (20, 2.0) | RSI MR (14, 30/50) |
|---|---|---|
| Total Return | +2.51% | +55.69% |
| Final Balance | $10,250.60 | $15,569.27 |
| Total Trades | 31 | 13 |
| Win Rate | 64.5% (20W / 11L) | 61.5% (8W / 5L) |
| Profit Factor | 1.02 | 3.04 |
| Sharpe Ratio | 0.17 | 0.48 |
| Sortino Ratio | 0.25 | 0.77 |
| Max Drawdown | 52.18% | 23.19% |
| Average Win | $596.15 | $1,037.95 |
| Average Loss | $1,061.12 | $546.87 |
| Best Trade | +$1,813.70 | +$2,238.79 |
| Worst Trade | -$1,990.74 | -$1,402.21 |
| Time in Market | 25.62% | 16.04% |
| Total Fees | $129.50 | $363.84 |

What the Data Shows
The Bollinger version had a higher reported win rate but a lower reported total return: 2.51% versus 55.69% for RSI. Its 64.5% win rate was the highest in the comparison, yet its profit factor was 1.02, essentially break-even. The reason is in the average trade: the Bollinger strategy's average loss of $1,061.12 was nearly double its average win of $596.15. It won two trades out of three, and the one it lost undid the two it won.
The RSI version was the opposite profile. It won 61.5% of its trades, and its average win of $1,037.95 was nearly double its average loss of $546.87. A payoff ratio of 1.90 on top of a 61.5% win rate is a genuinely strong combination, and it produced a profit factor of 3.04, the best in the comparison.
Why the Bollinger Entry Is Softer Than It Looks
The lower Bollinger band is a statistical threshold, not a momentum threshold. Price can cross below the lower band while the selloff is still accelerating, because the band itself moves down with volatility. The strategy was buying bounces that had not yet formed, which is why its losers were so large.
The RSI threshold has a different property. RSI is a smoothed oscillator, and crossing below 30 requires the selling pressure itself to have slowed relative to recent gains. By the time the entry fires, the momentum of the selloff is genuinely exhausted, which is exactly the condition a mean reversion strategy needs.
The trade counts confirm it. The Bollinger version traded 31 times in five years, more than twice the RSI version's 13, and most of the extra trades were the bad ones. It was busier and worse, the signature of a threshold that fires too early.
The Drawdown Gap
The Bollinger version's max drawdown of 52.18% was more than double the RSI version's 23.19%. That gap is the practical difference between the two strategies: the Bollinger trader would have sat through a hole twice as deep to earn one twentieth of the return. A 52% drawdown needs a 109% gain to recover, and most traders do not sit through that.
The Practical Lesson
Implementation choice decides the outcome: two mean reversion strategies on the same asset and window produced +2.51% and +55.69%
Win rate alone is not the story: the higher reported win rate did not produce the higher reported total return.
The RSI 30 entry fired when momentum was actually exhausted; the Bollinger band entry fired while selloffs were still accelerating
Drawdown is the tiebreaker: 23.19% versus 52.18% is the difference between a strategy you can hold and one that ends your account
The Bollinger versus RSI mean reversion question is settled for this window: the RSI implementation was the better mean-reverter on Bitcoin, because its entry actually caught exhausted selloffs. The next step is to test variations: a tighter Bollinger band, an RSI exit at 60, or a higher timeframe filter. Each variation needs its own backtest before it earns a place in a live strategy.
Run these two mean reversion strategies yourself and test your own variations on CoinQuant. Run this Bollinger vs RSI backtest free on CoinQuant
Disclaimer:
Key Takeaway