Bollinger Bands Mean-Reversion on Bitcoin: What 2 Years of Backtest Data Shows
.png)
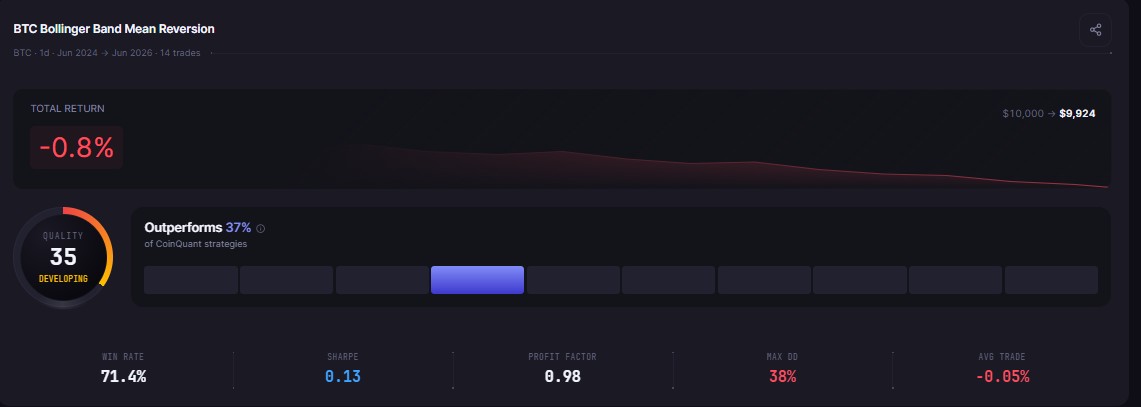
Bollinger Bands mean-reversion is one of the most frequently discussed setups in crypto: when price closes below the lower band, the thinking goes, it is statistically stretched and likely to snap back toward the average. We ran this bollinger bands strategy backtest crypto traders describe constantly on BTCUSDT, buying every daily close below the lower band and exiting on a return to the middle band. Over two full years of Bitcoin data, from June 22, 2024 to June 22, 2026, the strategy produced a 71.4% win rate and a total return of negative 0.76%. That near-breakeven headline conceals a structural problem that the metric table makes impossible to miss.
The Strategy and Test Setup
The strategy operates on the daily chart with a single rule set: enter long when the daily close falls below the lower Bollinger Band (20-period, two standard deviations). Exit when the daily close crosses back above the 20-period middle band. No stop loss at the position level. Long positions only.
Test parameters:
Asset: BTCUSDT
Timeframe: Daily candles
Period: June 22, 2024 to June 22, 2026 (two years)
Starting capital: $10,000
Fees: 0.1% taker, modelled on every trade
Direction: Long only
Kaiko institutional data powers the backtest, sourced from Binance spot pricing back to 2017 for Bitcoin. No conditions were adjusted after reviewing the output. Every metric below is reproduced exactly as CoinQuant's backtesting engine returned it.
The Full Backtest Results
Why a 71.4% Win Rate Still Lost Money
The 71.4% win rate is a genuine signal. Ten of 14 trades closed green. That is well above the 50% threshold that most traders would consider a baseline for a workable system. If win rate were the only metric that mattered, this strategy would look solid.
The Profit Factor is 0.98. Below 1.0. That single number means total losses exceeded total gross gains over the full two-year window.
The payoff ratio explains exactly how. The average winning trade returned $487.54. The average losing trade cost $1,237.73. That is a ratio of 0.39, meaning every dollar gained on winning trades came with roughly $2.54 of exposure on the losing side. Across 14 trades, the four losses outweighed the ten wins in dollar terms, and the account ended the two-year test down $75.56.
The worst trade lost $1,740.20 against a best trade gain of $1,209.14. A single losing position exceeded the size of the best winning trade. This is the core structural problem with mean-reversion strategies that carry no hard stop: when Bitcoin moves below the lower Bollinger Band and keeps falling instead of reverting, the position stays open and the loss grows until the exit condition finally fires at the middle band from far lower than the entry.
The Max Drawdown Warning
The -0.76% total return looks almost flat. An account starting at $10,000 ended at $9,924.44 after two years. But the path to that near-zero endpoint included a peak drawdown of 37.97%. During the test window, the account fell from a high of roughly $10,000 to a trough just over $6,000 at its worst point before recovering.
A 37.97% drawdown on a long-only mean-reversion strategy is a serious risk signal for any trader sizing positions meaningfully. The CAGR of negative 0.38% says this strategy produced essentially no return. The max drawdown of 37.97% says it required a 37.97% tolerable loss to get there. That risk-adjusted picture is what the Calmar Ratio of negative 0.01 captures: the annualised loss was a fraction of the maximum drawdown, meaning the drawdown was far larger than the return in either direction.
The Sharpe Ratio of 0.13 sits marginally above zero, which means the strategy technically produced a small positive risk-adjusted return per unit of volatility. But the Sortino Ratio of 0.08 and the Calmar Ratio of negative 0.01 tell a different story when downside risk is isolated. The strategy's positive Sharpe is almost entirely a product of its high win rate on small positive returns, not a durable edge.
14 Trades Over Two Years
The strategy generated just 14 entries across two years of daily Bitcoin data. Daily Bollinger Band breaks are relatively rare when the window is set at two standard deviations. That low trade count carries two implications.
First, the statistical confidence in the results is limited. With 14 trades, even a few outliers shift the aggregate metrics meaningfully. The Profit Factor of 0.98 is essentially breakeven territory, and a different two-year window with different market conditions could push it either side of 1.0.
Second, the $68.00 in total fees is minimal relative to the position size, which means fee drag is not the issue here. The problem is structural: the exit rule (middle band reversion) produces exits that are too slow on the losing trades. When Bitcoin dips below the lower band and continues lower for several days or weeks, the position holds through the full drawdown and exits only when price recovers to the 20-period average, which can be a long time and a large loss below entry.
Increasing the position size on any one of the four losing trades would have turned this strategy sharply negative. The near-zero return is not robust to size.
Three Modifications Worth Testing
The two-year results are a roadmap for what to change, not a reason to abandon the approach.
Add a hard stop loss. The average losing trade cost $1,237.73. Setting a stop at 8% to 10% below the entry price would cap each loss well below that average and immediately improve the payoff ratio. The win rate may fall slightly as some trades hit the stop before reverting, but the impact on Profit Factor would likely be positive.
Add a volatility filter at entry. Bollinger Band breaks during high-volatility regimes, when Bitcoin is moving fast and the bands are wide, tend to produce larger and longer adverse moves. Adding a condition such as requiring the band width to remain below a defined threshold filters out the most dangerous entries and improves average trade quality.
Extend the exit target. Exiting at the middle band captures only partial reversion. Extending the target to the upper band, or adding a percentage profit target above the middle band, increases the average winning trade and shifts the payoff ratio upward without requiring a filter on entries.
All three adjustments are testable on CoinQuant without writing a line of code. Adjust the conditions in the AI strategy builder, re-run on the same two-year window, and compare the revised Profit Factor and Max Drawdown directly against these baseline numbers.
Disclaimer:
This content is for educational and informational purposes only and does not constitute financial, investment, or trading advice. All strategies and examples are for illustrative purposes and do not guarantee results. Always conduct your own research before making financial decisions.
Key Takeaway