Bollinger Bands Backtest on Ethereum: What 6 Months of Data Shows

Bollinger Bands are one of the most used indicators in crypto trading, and one of the most misused. Most traders look at price touching the upper or lower band and assume a reversal is coming. Many believe the real opportunity isn't at the bands themselves. It's in the squeeze that comes before the move. We backtested the squeeze strategy on Ethereum. Here is what 6 months of data actually reveals.
The Strategy We Tested
Entry (3 conditions, sequential across candles):
BB(20) declining on 4H. The squeeze is active; volatility is contracting.
Price reaches below the lower Bollinger Band. The contraction has pushed price to an oversold extreme. This is the setup candle (the candle's low, wick, or prior-bar close dipped below the lower band).
Close above the middle SMA (20-period). Price has bounced back above the midline, confirming the reversal from the lower-band extreme. Enter long on the next open.
This is a lower-band squeeze reversal setup: the squeeze identifies the coiled market, the lower-band tag identifies the oversold extreme, and the close above the midline confirms the mean-reversion bounce is underway. It is not a breakout entry. The trade is taken after the reversal has already started.
Exit: Exit when price closes above the upper Bollinger Band. The upper band is the profit target. The idea is to ride the expansion from the lower-band extreme to the upper-band extreme. On a squeeze that resolves bullishly, this captures the full width of the band expansion.
Stop Loss: None in this test. This is the single biggest structural flaw. Without a risk cap, losing trades ran an average of 84 hours (3× longer than winners). A 3–5% stop loss on entry would have materially improved the risk profile by capping drawdowns before they compound.
What Is a Bollinger Band Squeeze?
Bollinger Bands consist of three lines: a 20-period simple moving average (the middle band), and upper and lower bands plotted at ±2 standard deviations from that average. When volatility is low, the bands contract. When volatility spikes, the bands expand.
A squeeze occurs when the bands narrow to their tightest point relative to recent price action. This contraction signals that the market is coiling, compressing into a range where directional conviction is low. The squeeze itself is direction-agnostic: it indicates reduced volatility, not a guaranteed expansion. The idea behind squeeze-based strategies is that low-volatility periods tend to be followed by higher-volatility periods, but the direction and magnitude of the expansion are not predictable from the squeeze alone.
John Bollinger describes the squeeze as 'a period of low volatility that occurs before a period of high volatility.' The bands narrow, then expand. Cryptocurrency markets, with their higher baseline volatility, can produce sharper expansions than traditional assets, but they can also produce false signals and whipsaws at a proportionally higher rate. The squeeze identifies a regime shift in volatility; it does not predict direction or profitability.
How to Spot a Squeeze on Ethereum
Three signals confirm a BB squeeze on ETH:
Band Width at 6-month low: Compare the distance between the upper and lower band to its own 6-month range. When it drops into the bottom 10th percentile, a squeeze is forming.
Price coiling near the middle SMA: During a true squeeze, price oscillates in a tight range around the 20-period SMA. The candles become small, overlapping, and directionless.
Volume declining: Volume typically contracts during the squeeze itself, then expands on the breakout candle. Low-volume squeezes that resolve on above-average volume tend to show stronger follow-through, though volume confirmation alone does not guarantee direction.

Backtest Results: What 6 Months of Data Shows
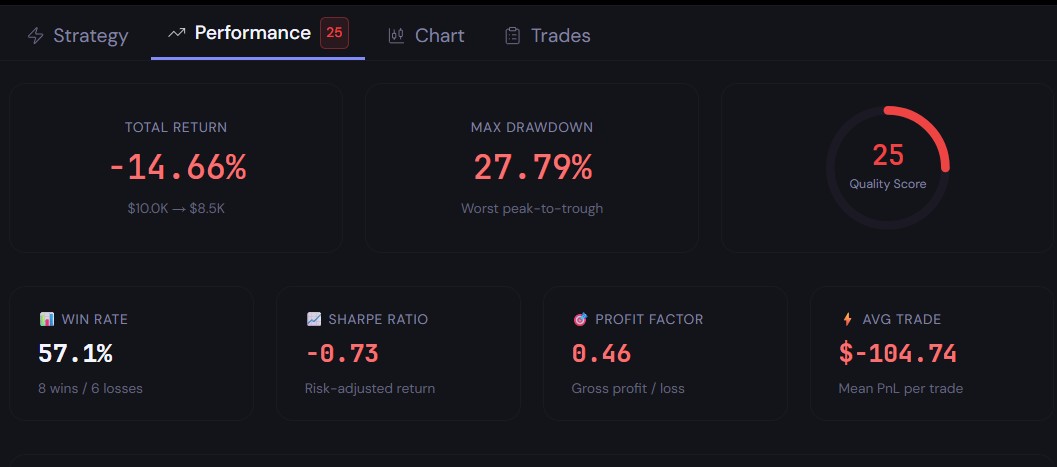
Key Metrics
Total Return: −14.66% ($10,000 → $8,534)
Win Rate: 57.1% (8 wins / 6 losses)
Max Drawdown: 27.79%
Sharpe Ratio: −0.73 (negative risk-adjusted return)
Profit Factor: 0.46 (gross loss is 2.2× gross profit)
Total Trades: 14 | Avg Trade: −$104.74 | Avg Win: +$153.92 | Avg Loss: −$449.63
Payoff Ratio: 0.34 (average loss is 3× average win)
Time in Market: 17.4% | Total Fees: $246.18 | Consecutive Wins: 3 | Consecutive Losses: 2 | Max Consecutive Wins: 5
What the Numbers Mean
The lower-band squeeze reversal strategy, tested without a stop loss on ETH/USDT 4H over 6 months, lost money. Despite a 57.1% win rate, the strategy is net-negative because losses are 3× larger than wins. The classic picking-up-pennies-in-front-of-a-steamroller problem. The negative Sharpe ratio (−0.73) and profit factor of 0.46 mean you are being paid less than you risk. With a payoff ratio of 0.34, the strategy needs a 75%+ win rate just to break even; it has 57%.
What the Backtest Reveals
The 6-month backtest exposes a hard truth: a lower-band squeeze reversal, executed without risk controls, is not a standalone edge. The 57% win rate looks respectable, but with an average loss 3× larger than the average win (payoff ratio 0.34), you need a roughly 75% win rate just to break even. This strategy delivers 57%. That gap is not randomness. It is structural.
Three structural problems stand out:
No stop loss: Losing trades ran 84 hours on average vs 29 hours for winners. Without a risk cap, losers compound. A 3% stop would have capped the damage on most losing trades.
No trend filter: The strategy takes every squeeze + lower-band-tag signal regardless of broader market structure. A long-only strategy entering at lower-band extremes during a bearish macro regime is structurally disadvantaged: it is fading the dominant trend.
Entry timing is imprecise: The sequential conditions (squeeze, lower-band tag, close above midline) can produce multiple entry signals within a single squeeze episode. A declining BB condition can persist for several candles; each lower-band retest that closes above the midline generates a new entry. 14 trades over 6 months is not excessive, but the triggers are not uniquely timed. The signal fires whenever the pattern recurs, not when the squeeze is ready to resolve.
The core insight: Squeezes can precede directional moves, but a squeeze alone, even combined with a lower-band entry filter, does not produce a positive expectancy without risk management. The 57% win rate masks the fact that the average loser (−$449) is nearly 3× the average winner (+$154). This is the statistical signature of an unbounded mean-reversion system: it collects small gains when the bounce works, and suffers large losses when the trend continues through the entry. Adding a stop loss and a directional filter (for example, only take longs above a longer-term moving average) would address the structural asymmetry.
How to Run This Backtest Yourself
On CoinQuant, select ETH/USDT on the 4H timeframe. Add Bollinger Bands (20,2). Set entry when BB(20) is declining AND price is below the lower Bollinger Band AND price closes above the middle SMA. Exit when price closes above the upper Bollinger Band. Crucially, add a 3–5% stop loss. Run from Nov 2025 with $10,000 starting capital and 0.1% fees. This produces the same 14 trades but with risk-controlled downside.
The BB squeeze is a useful volatility signal, but it is not an edge on its own. This backtest shows that even with a well-defined entry framework (squeeze filter, lower-band extreme, midline confirmation), the strategy loses money without proper risk controls. The lesson is structural, not anecdotal: a system that takes small mean-reversion profits without capping trend-following losses will inevitably produce a negative payoff ratio. Add a stop. Add a trend filter. Then test again.
Try it yourself: Backtest this strategy (with a stop loss this time) free on CoinQuant
Disclaimer:
This content is for educational and informational purposes only and does not constitute financial, investment, or trading advice. Past performance does not guarantee future results. Trading cryptocurrencies involves substantial risk of loss.
Key Takeaway