
Bias Indicator Strategy Backtest on Bitcoin: Does Deviation Predict Reversals?
Buy the dip is the oldest instinct in trading, and the Bias indicator is that instinct turned into arithmetic. Instead of guessing when price is cheap, it measures exactly how far price has stretched away from its moving average, in percent, and lets a threshold do the deciding.
The mean-reversion thesis sounds tidy: when Bitcoin is stretched far enough below its own average, the snap back is tradeable. The question this article tests is whether the numbers agree. A single mechanical Bias strategy on BTCUSDT daily, from August 2021 to August 2026, fees modeled, measured against simply holding Bitcoin.
What the Bias Indicator Strategy Actually Does
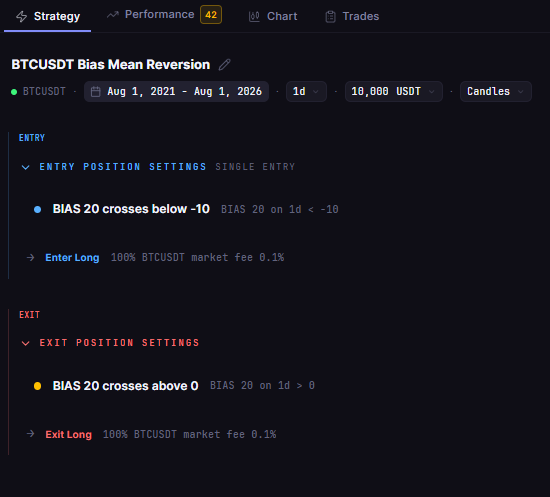
Bias is a percent stretch meter. It takes the distance between close and a moving average, divides by the moving average, and multiplies by 100. A reading of -10 means price sits 10% below its average; a reading of 0 means price has returned exactly to it.
This test uses the classic mean-reversion reading on a 20-period Simple Moving Average:
- Entry: Bias(20) crosses below minus 10 (price stretches at least 10% below its 20-day average)
- Exit: Bias(20) crosses above 0 (price returns to the average)
Long only, one position at a time, no leverage, on BTCUSDT daily. No stop loss, no take profit beyond the reversion itself. The strategy is deliberately pure: does a deep stretch below the average pay, or does it just identify weakness?
Test Setup
| Parameter | Setting |
|---|---|
| Strategy | BTC Bias 20 Reversion 1D 2021-2026 |
| Instrument | BTCUSDT (spot, Binance) |
| Timeframe | Daily (1D) |
| Tested window | 2021-08-01 to 2026-08-01 |
| Entry | Bias(20, SMA) crosses below -10 |
| Exit | Bias(20) crosses above 0 |
| Direction | Long only, no leverage |
| Initial capital | $10,000 |
| Position size | 100% of equity per entry |
| Fees | 0.1% taker, modeled |
| Data source | Kaiko via CoinQuant |
| Baseline | BTC Buy and Hold 1D 2021-2026 (same window) |
The Backtest Results
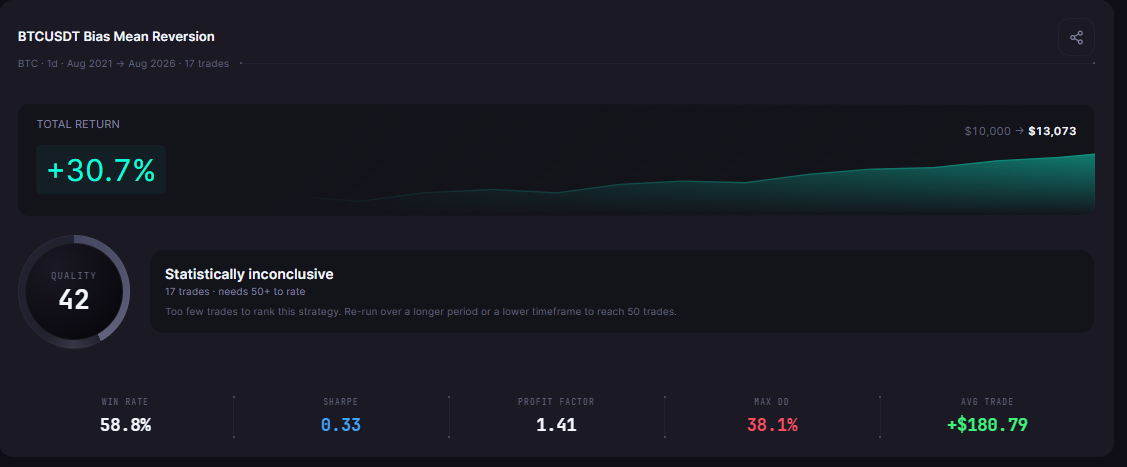
The Bias strategy turned $10,000 into $13,073.45, a +30.73% return from 17 trades, while Bitcoin itself returned +57.33% over the same window.
| Metric | Strategy | Buy and Hold |
|---|---|---|
| Total Return | +30.73% | +57.33% |
| Final Balance | $13,073.45 | $15,733.43 |
| Total Trades | 17 | 1 |
| Win Rate | 58.8% (10W / 7L) | n/a (single hold) |
| Profit Factor | 1.41 | n/a |
| Sharpe Ratio | 0.33 | 0.44 |
| Sortino Ratio | 0.49 | 0.63 |
| Max Drawdown | 38.13% | 76.63% |
| Average Win | $1,051.45 | n/a |
| Average Loss | $1,063.01 | n/a |
| Best Trade | +$1,864.56 | n/a |
| Worst Trade | -$2,747.21 | n/a |
| Time in Market | 16.15% | 100% |
| Total Fees | $423.24 | $25.74 |
| CAGR | +5.50% | +9.48% |
What the Data Shows
The first finding is that the instinct works more often than it fails. A 58.8% win rate (10 wins against seven losses) and a profit factor of 1.41 say the average stretch below -10 did snap back enough to pay. Four of the six calendar years were positive: +$1,138.56 in 2021, +$2,612.14 in 2023, +$635.62 in 2024, and +$2,086.23 in 2025.
The second finding is that it still lost to holding, by a wide margin. +30.73% against +57.33% is not close, and the reason is structural. The strategy was in the market only 16.15% of the time, and a dip-buyer that sits out five sixths of a bull market compounds less than the market itself. Mean reversion harvests bounces; it does not ride trends, and on an asset that rose 57% across the window, the bounces were the smaller harvest.
The third finding is the tail risk, and it is the important one. The worst trade, -$2,747.21, entered at $26,574 during the June 2022 collapse and exited at $20,564 in July: a 10% stretch below the average became a 23% stretch before the bounce came. Deviation measures where price is, not where it must stop, and during a forced deleveraging price gets more stretched, not less. The best trade shows the other side: +$1,864.56 in four bars, entered at $20,362 and exited at $24,112 during the March 2023 banking panic, a violent, fast reversion that is exactly what this style is built to catch.
The fourth finding is the risk profile. The 38.13% maximum drawdown against holding's 76.63% is the honest benefit of trading only deep stretches: most of Bitcoin's decline happens above the -10 threshold, so the strategy simply was not there for it. Lower exposure and faster exits bought a quieter ride, at the cost of headline return.
When Deviation Predicts and When It Does Not
Across these five years, the pattern is consistent: deviation predicted reversion during liquidity shocks and failed during regime breaks. Feb 2022, March 2023, the February 2025 flush: each time price stretched, snapped, and the strategy collected. June 2022 and the 2026 decline played out differently; the stretch doubled down, and the long below the average became a liability that only the eventual recovery resolved.
That asymmetry is the practical core of the Bias indicator. It is not a crystal ball for bottoms. It is a probabilistic statement: most of the time, price stretched 10% below its 20-day average on Bitcoin has paid a bounce, and the exceptions cost several times the average win. Any real deployment needs to price that tail, either through a crash filter, a smaller position, or an acceptance that some trades will hurt.
The Practical Lesson
- The Bias(20) reversion strategy returned +30.73% on daily BTC over five years, trailing holding's +57.33% while using 16.15% of the market days
- The signal quality was real: 58.8% win rate, profit factor 1.41, and positive results in four of six calendar years
- The failure mode is a stretch that stretches further: the worst trade lost -$2,747.21 when a -10% deviation kept widening into a crash
- The drawdown advantage (38.13% versus 76.63%) is the case for this style, provided the crash tail is managed explicitly
Deviation does predict reversals on Bitcoin, more often than not, and that is precisely why the exceptions matter. Trade the stretches, respect that price can always stretch further, and let position sizing carry the risk that the threshold cannot.
Run this Bias backtest yourself and test your own reversion thresholds on CoinQuant. Backtest mean reversion strategies free on CoinQuant
Disclaimer:
Key Takeaway
