
AI Price Predictions vs Backtesting: What Should You Actually Trust?

In late July 2026, ChatGPT published a Bitcoin price prediction of roughly $60,500 for the end of August, within a $57,000 to $70,000 trading range, and the coverage went wide. Days later, other ChatGPT-based forecasts targeted $95,000 to $110,000 by the end of 2026. The forecasts use different target dates, so they are not directly comparable and are not necessarily mutually exclusive.
Meanwhile, a different kind of AI output sits in the CoinQuant strategy library: AI-generated trading strategies with full backtest results, verified on historical data. This article compares the two uses of AI in trading, price prediction versus backtesting, and explains why one is opinion and the other is evidence.
What an AI Price Prediction Actually Is
An AI price prediction is a generated forecast, usually a number, a range, or a probability table, produced in response to a prompt like "where will Bitcoin be in August?". The model compresses its training data, which includes past prices and past predictions, into a plausible answer.
The problems are structural, not technical. The prediction is not testable in advance, it is not reproducible in a meaningful way, and it carries no error accounting that distinguishes a good forecast from a lucky one. When the same model is asked the same question twice in one month, it produced $60,500 for August and $95,000 to $110,000 for year-end, both with apparent confidence.
None of this means the prediction is worthless. It means it is opinion, shaped by data and presented as a number.
What a Backtest Actually Is
A backtest is the replay of a defined rule on historical data with fees, slippage and drawdown included. It produces metrics that can be checked, reproduced, and falsified: total return, win rate, profit factor, Sharpe ratio, max drawdown.
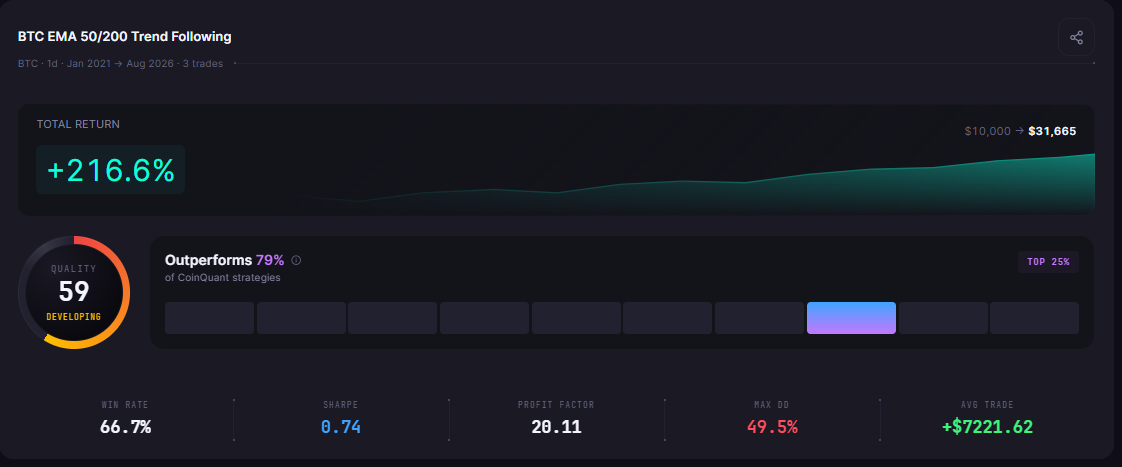
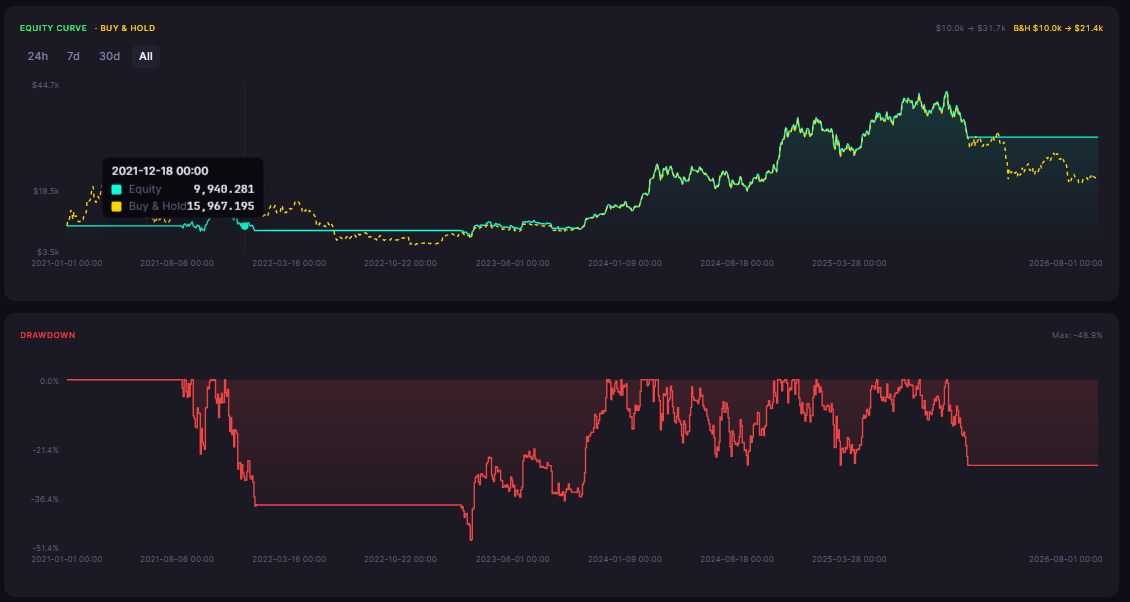
The AI-generated strategies in the CoinQuant library are the direct contrast. The AI EMA 50/200 1D Trend Strategy was generated from a plain-English prompt and then backtested over five years of Bitcoin data. The result is a set of checkable numbers: +216.65% total return, three trades, profit factor 20.11, max drawdown 49.46%. You can disagree with the strategy, and you cannot disagree with the backtest's arithmetic.
The Comparison in One Table
| Dimension | AI price prediction | Backtesting |
|---|---|---|
| Output | A forecast price or range | Metrics from replayed historical data |
| Testability | Not testable until the date arrives | Fully testable, reproducible on demand |
| Falsifiability | Weak, no defined criteria for being wrong | Strong, metrics either match or they do not |
| Error accounting | None published | Fees, slippage, drawdown all explicit |
| Time horizon | Days to months, single instance | Any window, any regime, repeatable |
| Failure mode | Confidently wrong, no self-correction | Badly fitted to history, caught by out-of-sample tests |
The table is the whole argument: predictions and backtests answer different questions. Predictions answer "what will happen?", with no method to check. Backtests answer "what would have happened?", with a method that anyone can re-run.
The Risk of Acting on Predictions
Acting on a single price prediction is a bet on a number without a model of the downside. The August 2026 prediction of $60,500, made when Bitcoin was trading in the $58,000 to $64,000 range, is a small directional view, and a trader who sized a position on it has no answer to the question "what if it is wrong?".
The same prompt that produced that number also produced year-end targets of $95,000 to $110,000. Both were published in the same month. The spread between them is the honest measure of the prediction's precision, and it is wider than the entire range the market was trading in.
Why Backtests Beat Predictions for Decision-Making
A backtest cannot tell you what Bitcoin will do next, and that is exactly why it is the better decision tool. It replaces an unknowable question, "what will price do?", with a testable one, "does this rule have an edge on the data that exists?".
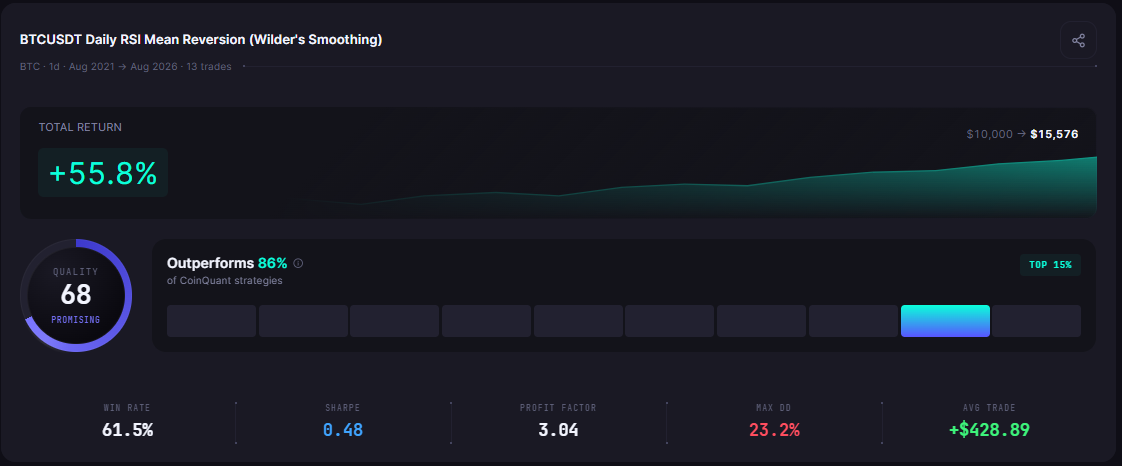
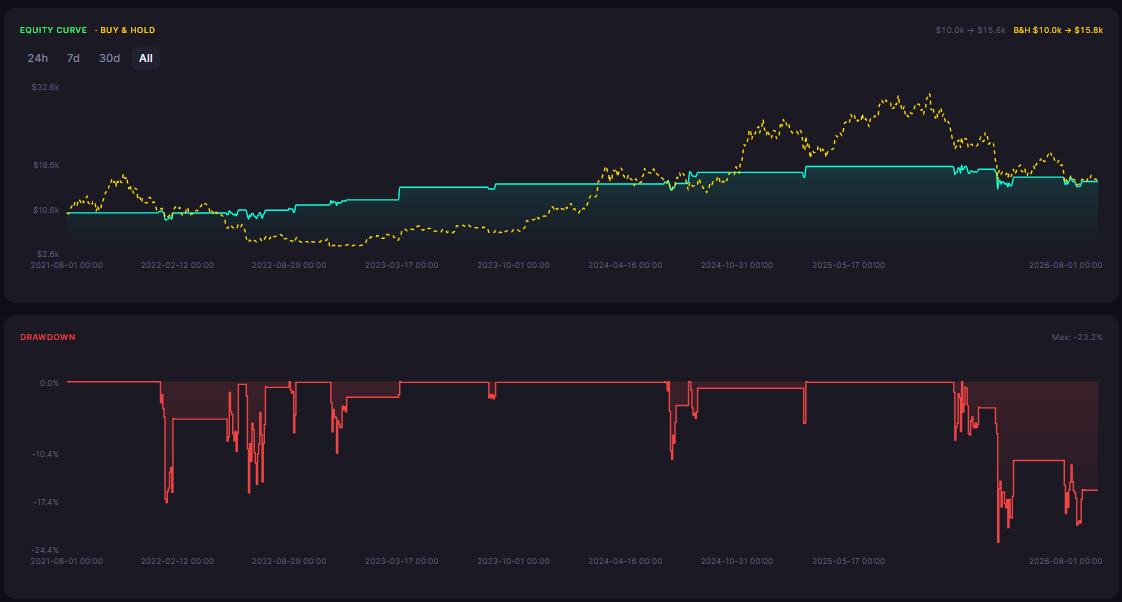
The verified library example makes the point concretely. The BTC RSI(14) Mean Reversion 1d strategy, backtested on daily Bitcoin from August 2021 to August 2026, returned +55.76% with a profit factor of 3.04 and a 23.21% max drawdown. Those numbers do not predict tomorrow's price. They describe what the rule did across a full cycle, including a bear market, which is precisely the information a prediction cannot provide.
The same rule on Ethereum lost 57.25% in the same window. That contrast is the kind of finding that changes decisions, and it only exists in backtest form.
How to Use Both Correctly
The practical hierarchy:
Use backtests for decisions. Strategy selection, position sizing, and drawdown tolerance should be based on verified historical behavior
Use predictions as context, never as instructions. A forecast is a data point about market narrative, not a trading signal
When a prediction and a backtest disagree, the backtest is the one with a method. The prediction has no error accounting to argue against
Re-run the backtest when the regime changes. Evidence ages, and the answer to "does the edge still hold" is always a new test, never an opinion
The Practical Lesson
Predictions are opinions with formatting. The $60,500 August call and the $95,000 to $110,000 year-end call came from the same kind of prompt in the same month
Backtests are evidence with a method. Reproducible, falsifiable, and complete with fees and drawdown
The decision-relevant question is about rules, not prices. Which strategy has an edge on the data that exists, and that is a backtest question
Keep the hierarchy explicit: data over narrative, method over confidence, verified results over published numbers
Trust data, not opinions: backtest free
Disclaimer:
Key Takeaway