
AI-Generated vs Human-Built Trading Strategies: Head-to-Head Backtest on Bitcoin

The argument about whether AI can build trading strategies usually happens without data. CoinQuant is one of the few places where both sides can be produced and tested under identical conditions, because the AI strategy builder and the human-built library run on the same engine, same data, same fees.
The published RSI examples use different date windows, so this side-by-side comparison does not isolate AI-generated versus human-built rules under identical conditions.
This article runs three head-to-head comparisons on Bitcoin: two clean AI-versus-human pairs, and one convergence case where the AI independently arrived at exactly the same rule a human had already published in the library. All six strategies are tested library strategies, and every number below comes from their verified CoinQuant backtests.
How the Comparison Works
Each pair matches an AI-generated strategy against a human-built strategy in the same indicator family and on the same instrument:
Pair 1, RSI family on 4-hour: AI RSI 4H Cross Strategy versus BTC RSI(14) Mean Reversion 4h
Pair 2, EMA family on daily: AI EMA 50/200 1D Trend Strategy versus BTC EMA Crossover 20/50 1D 2021-2026
Convergence case, breakout family on daily: AI Donchian 1D Breakout Strategy versus BTC Breakout 1D 2021-2026
The AI strategies were produced by describing the rule in plain English. The human strategies were written and published in the library by traders. Both sides then ran through the identical backtest engine with 0.1% taker fees modeled on every trade.
Pair 1: The RSI Family on 4-Hour
The AI strategy enters when RSI(14) crosses above 50 on the 4-hour chart and exits when it crosses below 50, a momentum read of the oscillator. The human strategy enters when RSI(14) crosses below 30 and exits above 50, a mean reversion read. Both are long only, no leverage, 100% position size.
| Metric | AI RSI 4H Cross Strategy | BTC RSI(14) Mean Reversion 4h |
|---|---|---|
| Backtest window | Jan 2023 to Aug 2026 | Aug 2024 to Aug 2026 |
| Total Return | +28.06% | -9.26% |
| Final Balance | $12,806.09 | $9,073.84 |
| Total Trades | 401 | 33 |
| Win Rate | 20.9% | 69.7% |
| Profit Factor | 1.04 | 0.87 |
| Sharpe Ratio | 0.37 | -0.06 |
| Max Drawdown | 58.45% | 31.51% |
| Total Fees | $14,471.38 | $702.68 |
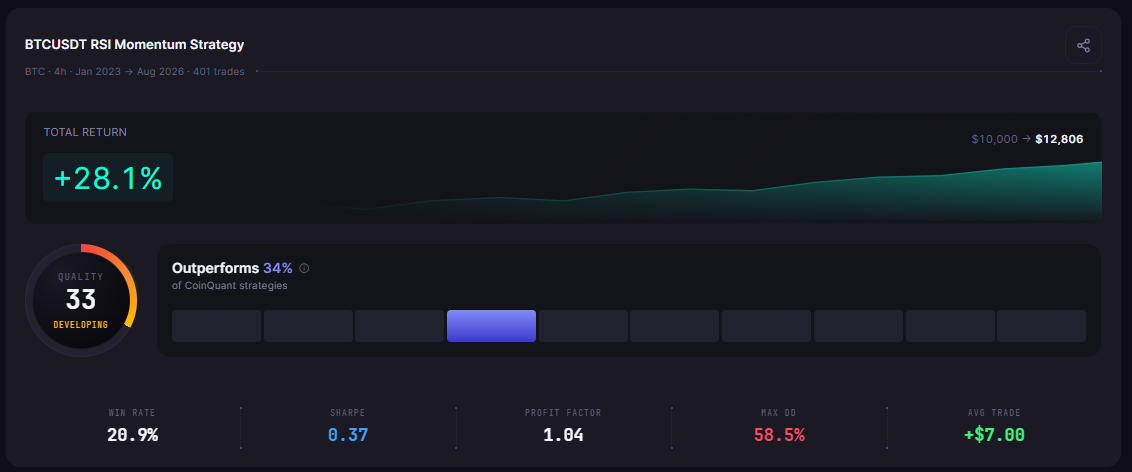
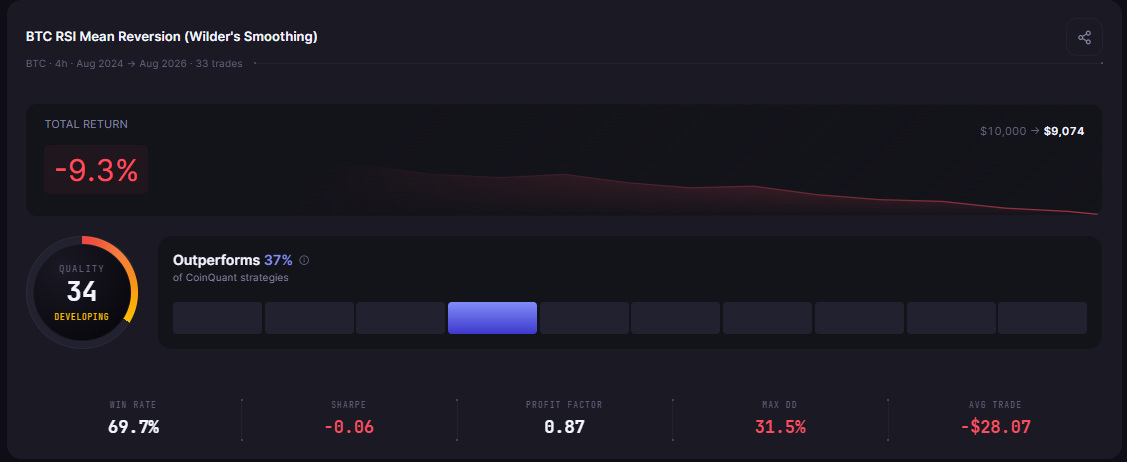
The AI strategy won on return but it is a fragile win. A profit factor of 1.04 means it produced $1.04 of gross profit per dollar of gross loss, barely above break-even, while paying $14,471.38 in fees across 401 trades. The human strategy lost money but with a 69.7% win rate, because its average loss of $698.82 was 2.6 times its average win of $263.57. Neither result is a strategy worth deploying, and the backtest is what makes that visible.
Pair 2: The EMA Family on Daily
The AI strategy trades the EMA 50 crossing the EMA 200 on the daily chart. The human strategy trades the faster EMA 20 crossing EMA 50. Both are classic trend-following crossovers on the same instrument and window, January 2021 to August 2026.
| Metric | AI EMA 50/200 1D Trend Strategy | BTC EMA Crossover 20/50 1D 2021-2026 |
|---|---|---|
| Backtest window | Jan 2021 to Aug 2026 | Jan 2021 to Aug 2026 |
| Total Return | +216.65% | +79.16% |
| Final Balance | $31,664.87 | $17,916.00 |
| Total Trades | 3 | 16 |
| Win Rate | 66.7% | 37.5% |
| Profit Factor | 20.11 | 1.55 |
| Sharpe Ratio | 0.74 | 0.48 |
| Max Drawdown | 49.46% | 51.62% |
| Total Fees | $78.34 | $459.09 |
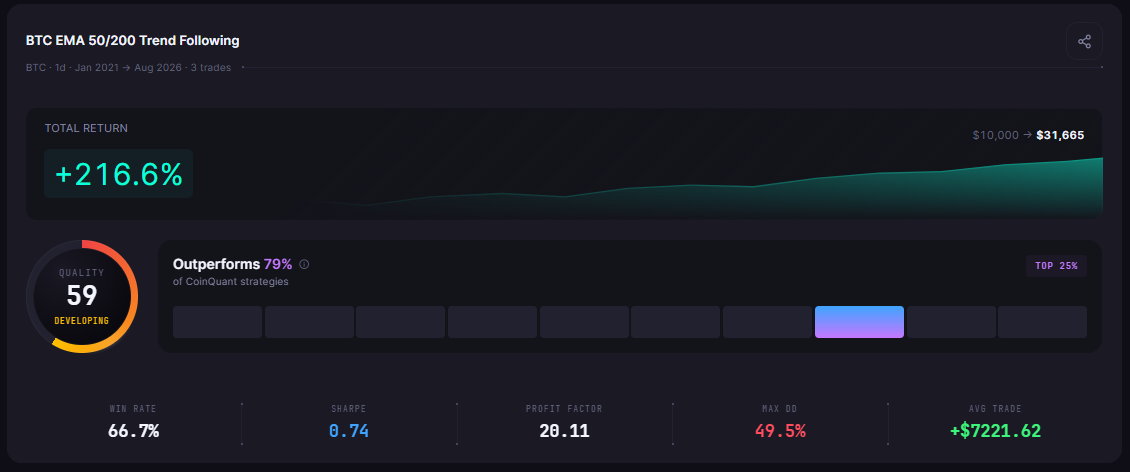
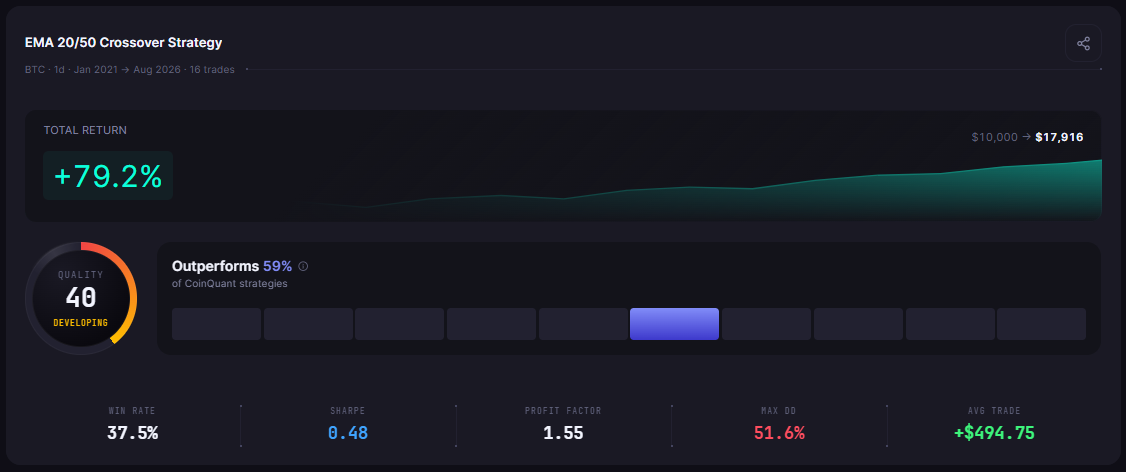
The AI strategy's +216.65% is the best headline number in this article, and it deserves scrutiny. It traded three times in 5.6 years, and its entire outperformance came from a single trade closed in 2025 worth +$22,234.93, while its one losing trade cost $1,133.59. The human 20/50 crossover traded 16 times, produced a profit factor of 1.55, and delivered +79.16%.
The honest read: the AI settings concentrated the same trend-following idea into a bet that almost never trades. That is a real edge in the data, and it is also a three-trade sample that no serious trader should size as if it were proven.
Convergence: The Donchian Case
The third comparison did not happen as planned, and the reason is the finding. The AI strategy was prompted to buy when price breaks the 20-day high and sell on the 20-day low. The library already contained a human strategy with exactly that rule.
| Metric | AI Donchian 1D Breakout Strategy | BTC Breakout 1D 2021-2026 |
|---|---|---|
| Backtest window | Jan 2021 to Aug 2026 | Jan 2021 to Aug 2026 |
| Total Return | +118.43% | +118.43% |
| Total Trades | 24 | 24 |
| Win Rate | 50.0% | 50.0% |
| Profit Factor | 1.45 | 1.45 |
| Max Drawdown | 48.63% | 48.63% |
The rules are identical: close crosses above the Donchian channel upper band (the highest high of the previous 20 bars) to enter, and crosses below the lower band to exit. The engine produced identical results, which is the expected outcome for identical logic. Two independent authors, one human and one machine, converged on the same canonical breakout rule.
That convergence is not a failure of the comparison, it is the most interesting result in it. The human consensus breakout design and the AI's default breakout design are the same design, which suggests breakout rules are a stable optimum in the strategy space rather than a matter of taste.
What the Head-to-Head Actually Shows
Three findings survive the scrutiny:
The AI did not produce magic. Its best number came from one trade, and its highest-frequency strategy barely beat break-even while burning $14,471.38 in fees
The human library was not obviously better either. The human RSI mean reversion on 4-hour lost money, and the human 20/50 crossover underperformed the AI 50/200 on return
The convergence case is the real signal. Where the AI had a clear canonical answer, it found the same rule the library already contained
The comparison also exposes a difference in how the two sides fail. The AI strategies failed broadly, many small trades and fee drag. The human strategies failed narrowly, few trades with wrong timing. Both failure modes are visible in the metrics before a single dollar goes live, which is the entire point of backtesting an ai generated trading strategy before trading it.
The Practical Lesson
AI-generated strategies need the same validation as human ones. The AI EMA 50/200 looks unbeatable until you see the three-trade sample behind it
Fee drag is the AI blind spot. 401 trades generated $14,471.38 in fees on a barely positive edge
Canonical rules converge. When the AI designs a breakout from first principles, it reproduces the human library's Donchian 20 rule exactly
Test both sides on the same engine. That is the only way the comparison means anything, and it is exactly what the CoinQuant AI builder and library share
The next step is not to pick a side. It is to take the best rule from each family and run your own variants, with your own parameters, on the same data, before any capital is at risk.
Build your own AI strategy free on CoinQuant
Disclaimer:
Key Takeaway