ADX + RSI Strategy on Bitcoin: Filtering Noise with Backtest Data
.png)
RSI fires signals in every market condition. That is the problem. When price chops sideways, RSI bounces between oversold and overbought without any directional follow-through. You enter, price goes nowhere, you exit at a loss. Repeat. The adx indicator strategy backtest we ran addresses this directly: add ADX as a trend filter before the RSI signal can trigger, and you cut out the noise.
The strategy is simple. ADX measures trend strength. RSI identifies entry timing within that trend. The question is whether that combination actually improves outcomes on Bitcoin. We ran a 12-month backtest on BTC/USDT 4-hour data using Kaiko institutional data sourced from Binance via CoinQuant to find out.
What ADX Does (and Why It Matters for RSI Signals)
ADX, the Average Directional Index, does not tell you which direction price is moving. It tells you how strongly price is moving in any direction. A reading above 25 indicates a defined trend. Below 20, the market is ranging and directional moves are weak.
Most RSI traders ignore this distinction. They enter on any RSI oversold signal regardless of market structure. Some of those signals work. Many fire in sideways chop and bleed out before any trend materialises.
ADX solves this by acting as a gate: RSI entries only trigger when ADX confirms that a trend is actually in place. No trend, no trade. This is the core logic behind the adx rsi strategy bitcoin combination tested here, and it changes the character of the signal entirely.
A few things to know about ADX:
It is derived from the Directional Movement Index (DMI), using the +DI and -DI lines as inputs.
Period 14 is standard. Higher periods smooth the reading; lower periods make it more reactive.
ADX rising above 25 does not guarantee price continues in any direction, it confirms that momentum is present, not which way it points.
For a long-only strategy, ADX above 25 is a necessary condition, not a sufficient one. That is where RSI comes in.
The Combined Strategy Logic
The rules are straightforward:
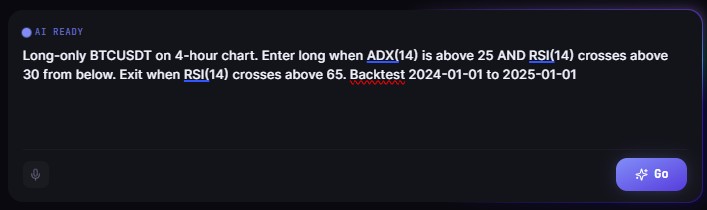
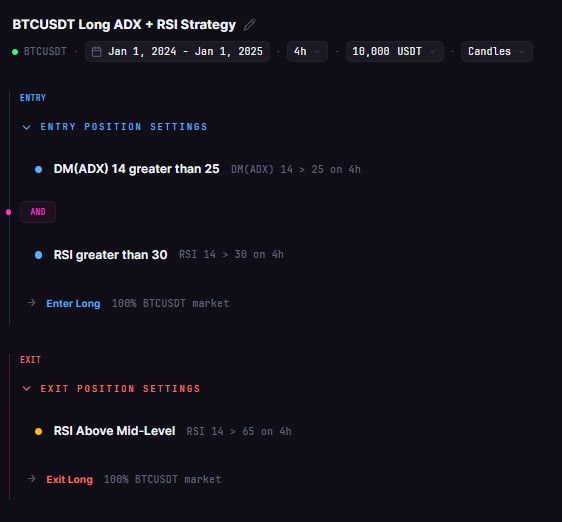
Entry (long): ADX(14) must be above 25 AND RSI(14) must cross above 30 from below. Both conditions must be true on the same 4-hour bar.
Exit: RSI(14) crosses above 65.
The ADX condition filters out ranging, directionless periods. The RSI cross above 30 identifies a momentum shift from oversold back into positive territory. The exit at RSI 65 captures the bulk of the move before the strategy risks getting caught in overbought territory, while leaving room for a proper trend to run.
Long-only. One position at a time. Full capital deployed per trade.
The logic for combining adx and rsi crypto strategies this way is deliberate: you wait for the market to show strength (ADX), then wait for a pullback and recovery within that strength (RSI cross above 30), then exit before the move exhausts itself (RSI at 65). Each condition serves a specific function.
What this setup deliberately avoids: entering during RSI oversold bounces in flat markets. Those trades look like opportunities on the RSI chart alone. They are not. ADX above 25 is the check that separates real from fake.
Backtest Configuration
Data: Kaiko institutional data sourced from Binance via CoinQuant.
Backtest Results


13.64% net return over 12 months, 11 trades, 54.55% win rate.
The profit factor of 1.74 means the strategy earned $1.74 for every $1.00 it lost. That is a meaningful edge across the sample. The payoff ratio of 1.45 confirms that wins were larger than losses on average, even without a dominant win rate.
The Sharpe ratio of 0.59 reflects the drawdown reality: 19.75% max drawdown is the strategy's pressure point. The strategy runs full capital per trade, so a losing sequence hits hard. The recovery stat shows it took 4,824 hours (roughly 201 bars) to recover from the deepest drawdown. That is meaningful context if you are evaluating this for live deployment.
Time in market of 31.79% is a feature, not a bug. The adx trading strategy backtest confirms the filter worked: most of the year was spent on the sidelines, not bleeding through weak signals.
What the Data Shows About Noise Filtering
Eleven trades over 12 months of BTC trading is a low count. That is the point.
BTC/USDT on the 4-hour chart generates hundreds of RSI crosses above 30 in a year. Without an ADX filter, most of those entries occur in ranging conditions where any momentum quickly fades. The ADX gate compressed that to 11 high-conviction entries.
Of those 11, six were winners. Five were losers. But because winning trades averaged $587.14 and losing trades averaged $406.00, the math works even with a sub-60% win rate. The payoff ratio of 1.45 means you did not need to be right most of the time to come out ahead.
The consecutive wins stat (four in a row) and consecutive losses stat (two in a row) also tell a useful story: losing runs were short. The strategy did not spiral into extended drawdowns because the ADX filter kept it out of the low-quality signal environments where chains of losses tend to accumulate.
A few things this backtest does not tell you:
How the strategy performs in a bear year. The 2024 period was broadly bullish for BTC. A choppy, declining market would likely suppress trade count further and may reduce win rate.
How slippage affects real execution. This test used 0% slippage. On 4-hour entries, real slippage is generally low but non-zero.
How position sizing changes outcomes. At 50% capital per trade, the max drawdown drops substantially, with proportional reduction in return.
The noise filtering thesis holds up in the data. The strategy is selective. Selective strategies have fewer data points to judge, which means you need to hold the results with appropriate context. Eleven trades over 12 months is a small sample. The direction of the numbers is encouraging; the sample size means it is not proof.
Running ADX + RSI on CoinQuant
CoinQuant is an AI trading platform that lets you build and backtest strategies like this one without writing code. The ADX + RSI setup above was built by describing the conditions in plain language. The platform interpreted that, structured the strategy logic, and ran the backtest against Kaiko institutional data automatically.
No scripting. No data pipeline setup. No local environment.
To replicate this setup or test variations, such as a lower ADX threshold (20 instead of 25), a different RSI exit level, or a multi-timeframe confirmation layer, you adjust the parameters and run a fresh backtest. The same process that produced the results above takes minutes on the platform.
The no-code approach also makes it easier to iterate quickly. If the 19.75% drawdown is too high for your risk tolerance, you test a position-sizing adjustment. If you want to add a stop-loss, you add it. Each change is reflected in a new backtest run without rebuilding anything from scratch.
Disclaimer:
This content is for educational and informational purposes only and does not constitute financial, investment, or trading advice. All strategies and examples are for illustrative purposes and do not guarantee results. Always conduct your own research before making financial decisions.
Key Takeaway