
ADA RSI Strategy Backtest: Does Cardano's Volatility Make RSI Signals More Effective?

RSI mean reversion has one of the strongest track records in CoinQuant's published Bitcoin research: buy when RSI(14) crosses below 30 on the daily chart, sell when it crosses back above 50. On Bitcoin, that rule turned $10,000 into roughly $15,500 over five years with a manageable drawdown. The question every Cardano trader then asks is whether the same rule works on ADA, and the honest answer requires a backtest, because ADA is not Bitcoin with a different logo.
Cardano trades with higher volatility and thinner institutional participation than Bitcoin, which changes both halves of the mean reversion bet: oversold conditions should arrive more often, and the bounces should be wilder in both directions. This article runs the identical RSI(14) mean reversion strategy on ADA/USDT and BTC/USDT over the same five-year window, August 2021 to August 2026, same rules, same fees, and lets the volatility difference show up in the numbers.
The Two Strategies
ADA RSI(14) Mean Reversion 1d
The exact library definition applied to Cardano:
Entry: RSI(14) with Wilder smoothing crosses below 30
Exit: RSI(14) with Wilder smoothing crosses above 50
BTC RSI(14) Mean Reversion 1d
The identical definition on Bitcoin, the tested library baseline whose results have been published in CoinQuant's earlier RSI research.
Both are long only, one position at a time, 100% of equity per entry, 0.1% taker fee modeled. The strategies differ in exactly one way: the asset.
Test Setup
| Parameter | ADA RSI Mean Reversion | BTC RSI Mean Reversion |
|---|---|---|
| Strategy | ADA RSI(14) Mean Reversion 1d | BTC RSI(14) Mean Reversion 1d |
| Instrument | ADAUSDT (spot, Binance) | BTCUSDT (spot, Binance) |
| Timeframe | Daily (1D) | Daily (1D) |
| Tested window | 2021-08-01 to 2026-08-01 | 2021-08-01 to 2026-08-01 |
| Entry | RSI(14) crosses below 30 | RSI(14) crosses below 30 |
| Exit | RSI(14) crosses above 50 | RSI(14) crosses above 50 |
| Direction | Long only, no leverage | Long only, no leverage |
| Initial capital | $10,000 | $10,000 |
| Position size | 100% of equity per entry | 100% of equity per entry |
| Fees | 0.1% taker, modeled | 0.1% taker, modeled |
| Data source | Kaiko via CoinQuant | Kaiko via CoinQuant |
The Backtest Results
Cardano's volatility did make RSI signals more frequent and more often right. It also made the losses far heavier when they came.
| Metric | ADA RSI(14) MR | BTC RSI(14) MR |
|---|---|---|
| Total Return | +110.04% | +55.69% |
| Final Balance | $21,003.99 | $15,569.27 |
| Total Trades | 16 | 13 |
| Win Rate | 75.0% (12W / 4L) | 61.5% (8W / 5L) |
| Profit Factor | 1.84 | 3.04 |
| Sharpe Ratio | 0.51 | 0.48 |
| Sortino Ratio | 1.02 | 0.77 |
| Max Drawdown | 55.98% | 23.19% |
| Average Win | $2,003.68 | $1,037.95 |
| Average Loss | $3,260.04 | $546.87 |
| Best Trade | +$10,635.49 | +$2,238.79 |
| Worst Trade | -$8,689.57 | -$1,402.21 |
| Time in Market | 21.33% | 16.04% |
| Total Fees | $113.55 | $363.84 |
What the Data Shows
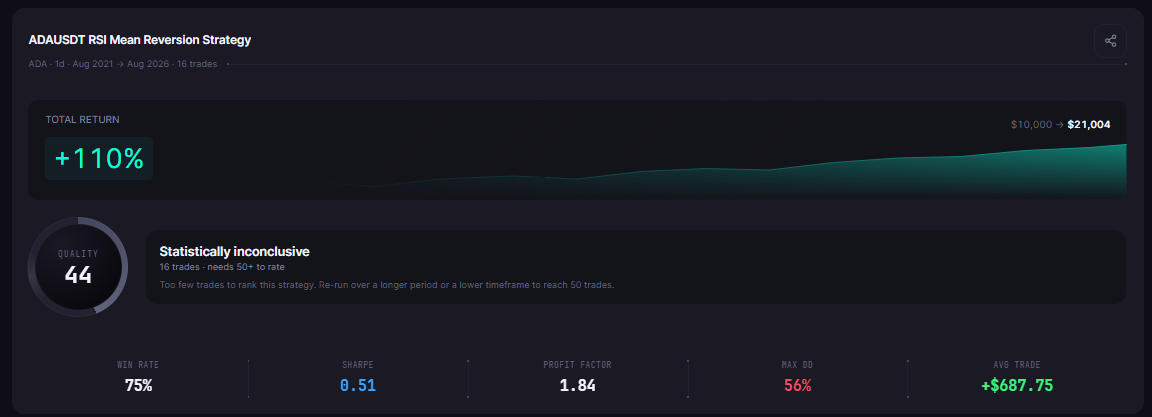
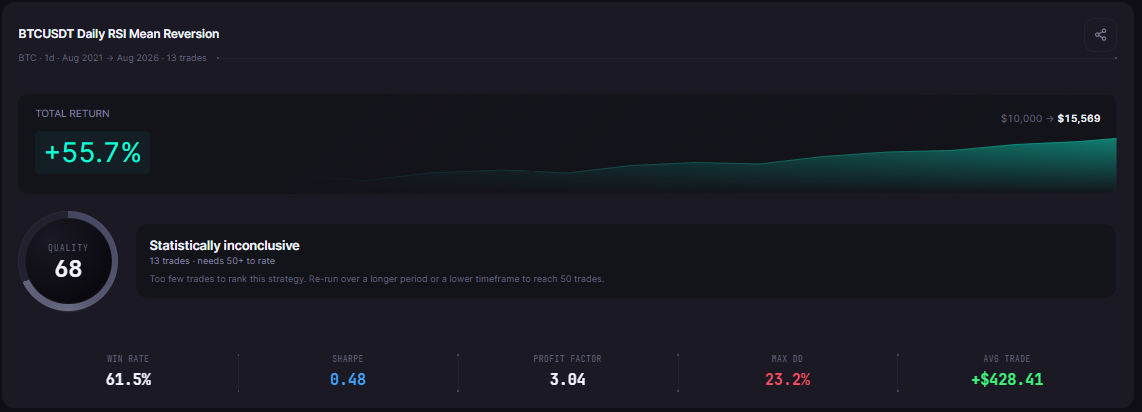
The headline answer to the article's question is yes and no. Cardano's volatility produced a higher win rate and a higher total return: 75.0% against Bitcoin's 61.5%, and +110.04% against +55.69%. The same rule that doubled the account on Bitcoin nearly tripled it on ADA. Volatility delivered more oversold signals (16 trades versus 13), and Cardano's sharper selloffs did bounce as mean reversion theory expects.
The second half of the answer is in the loss column. ADA's average loss was $3,260.04 against Bitcoin's $546.87, nearly six times larger, and its worst trade, -$8,689.57, was more than six times Bitcoin's worst loss of -$1,402.21. That single trade explains most of the drawdown gap: 55.98% on ADA versus 23.19% on Bitcoin. Cardano's volatility cuts both ways, and the strategy's profit factor tells the risk-adjusted story: 1.84 on ADA against 3.04 on Bitcoin.
Why the Loss Tail Is the Real Cardano Story
Mean reversion on a volatile asset is a bet that selloffs exhaust themselves. On ADA, that bet won 12 of 16 times, and the wins were large because the bounces were violent. But the four losses were not ordinary losses. In a crypto bear market, an oversold Cardano can stay oversold for months, and the RSI 30 entry that worked during selloffs caught the early phase of what became a sustained decline.
That asymmetry is exactly what the 55.98% max drawdown represents: a strategy that was right three times out of four, and wrong once in a way that took more than half the account. A drawdown of 55.98% requires a gain of roughly 127% to recover, which reframes the +110.04% headline: after the deepest hole, the account needed nearly everything it later earned just to get back to even.
The Practical Lesson
The same RSI(14) mean reversion rule on the same window returned +110.04% on ADA against +55.69% on BTC
Cardano's volatility produced a higher win rate, 75.0% against 61.5%, and materially larger winners, with a best trade of +$10,635.49
The cost was a fat loss tail: average loss nearly six times Bitcoin's, worst trade -$8,689.57, and a 55.98% max drawdown versus 23.19%
Higher volatility made the RSI signals more effective on the way up and more dangerous on the way down, which is why the profit factor (1.84 versus 3.04) is the number to compare
The Cardano RSI question is answered for this window: on daily ADA from August 2021 to August 2026, the identical mean reversion rule out-earned Bitcoin dramatically and took a drawdown most traders could not survive. The natural next steps are an ADA-specific risk exit to cut the loss tail, a slower RSI period, or position sizing scaled to Cardano's volatility, each tested against this verified ADA baseline before live capital.
Run the RSI mean reversion comparison on ADA and BTC yourself. Backtest it free on CoinQuant
Disclaimer:
Key Takeaway
